
Business process mapping is the practice of diagramming a workflow, step by step, so everyone can see who does what, when, and why. Use it before you improve a process, before you train someone new on it, or before you automate it.
- Improving a process: you need to see where time and quality get lost.
- Onboarding or training: new hires learn faster from a visual than a manual.
- Preparing for automation: software can’t automate what nobody has clearly defined.
A finished map typically shows the sequence of steps, decision points, who owns each step, and what goes in and comes out.
Key Takeaways
A business process map only creates value once it’s built with a defined scope, validated by the people doing the work, and paired with metrics to measure improvement.
| Point | Details |
|---|---|
| Define scope first | Write down the trigger, output, and exclusions before drawing a single box. |
| Match map type to question | Use swimlanes for handoffs, SIPOC for scope, VSM for waste, BPMN for automation. |
| Validate before rollout | Test the redesigned process on one team or route before scaling company-wide. |
| Track baseline metrics | Capture cycle time, wait time, and handoff count before and after changes. |
| Get hands-on help | Rebuildingthetrades turns finished maps into operating systems with KPI tracking and accountability training. |
Table of Contents
- What Does a Business Process Mapping Diagram Actually Show?
- Why Should a Trade Business Bother Mapping Its Processes?
- Which Type of Process Map Should You Use?
- What Symbols Do You Actually Need To Know?
- How Do You Create a Business Process Map Step By Step?
- How Do You Analyze a Map to Find Bottlenecks?
- What Tools Should You Use to Build a Process Map?
- What Mistakes Ruin a First Process Map?
- What Does a Real Trade-Business Process Map Look Like?
- Why Process Mapping Matters More Than It Gets Credit For
- Turn Your Process Map Into an Operating System
- Where To Learn More About Process Mapping
- Frequently Asked Questions
- Sources
What Does a Business Process Mapping Diagram Actually Show?
A process map makes work visible. It gives a team a shared, accurate picture of a workflow instead of a dozen different mental versions of “how we do things.” That shared understanding is the entire point. IBM defines process mapping as a way to represent workflow steps, roles, decision points, and inputs and outputs so teams can spot where things break down.
Before you draw anything, define scope: what triggers the process, what output signals it’s done, and what’s deliberately left out. Skip this and your map balloons into an unmanageable mess.
Detail level matters too:
- Level 0: a one-line view (Order to Cash, Dispatch to Invoice).
- Level 1: major phases, five to eight boxes, good for leadership reviews.
- Level 2: department-level steps, useful for cross-team handoffs.
- Level 3 or 4: task-by-task detail, needed for training or automation specs.
Most trade businesses only need Level 1 or 2 to fix real problems.
Why Should a Trade Business Bother Mapping Its Processes?
The payoff is concrete: fewer errors, faster training, cleaner audits, and a shorter list of guesses about where automation would actually help. Microsoft’s research on process mapping ties mapping directly to clarifying who owns what, surfacing bottlenecks, and supporting compliance and continuous improvement work.
- Training: a new dispatcher learns the job in days, not weeks, off a swimlane diagram.
- Compliance and audits: you can show an inspector or insurer exactly how a job gets handled, start to finish.
- Cycle-time reduction: mapping the permit-to-install process for an electrical job often reveals dead time that nobody noticed.
If your business runs any kind of structured improvement program, mapping is usually the first move in a Define, Measure, Analyze, Improve, Control cycle.
Which Type of Process Map Should You Use?
Different map types answer different questions, and picking the wrong one wastes time. Moxo’s comparison of process mapping techniques breaks it down clearly: flowcharts show sequence, swimlanes show ownership, SIPOC shows scope, value stream maps show waste, and BPMN shows precision for automation.
- Flowchart: answers “what happens next?” Good for a single-person, linear task.
- Swimlane (cross-functional): answers “who does this step?” Use it the moment a job crosses more than one team, like dispatch handing off to a technician.
- SIPOC: answers “what’s in scope, and who are the suppliers and customers?” Best for kicking off a mapping project before you get into detail.
- Value stream map (VSM): answers “where is waste hiding?” Best for parts flow, inventory, and cycle-time problems.
- BPMN (detailed/rendered): answers “can a system execute this?” Reserve it for automation or integration work.
- Hierarchical map: answers “how does this fit into the bigger picture?” Good for leadership-level overviews.
Match the map to the question, not the other way around.
What Symbols Do You Actually Need To Know?
You need four symbols to start: a rounded shape for start and end points, a rectangle for each activity, a diamond for decisions, and arrows for handoffs between people or systems.
Formal notation like BPMN adds precision, and IBM notes it’s worth the added complexity when you need automation integration or you’re sharing the map across separate organizations. For an internal dispatch or install process, stick with the basics.
Pro Tip: Pick one symbol set and write down what each shape means at the top of every map you create. Six months from now, nobody will remember your shorthand, including you.
How Do You Create a Business Process Map Step By Step?
Follow this sequence and you’ll avoid the two most common failures: mapping the wrong thing, and mapping something nobody validates.
- Define scope and purpose. Write down the trigger, the end output, and what’s excluded. Signavio’s process mapping guide treats this as the non-negotiable first step because a map without boundaries never stops growing.
- Identify stakeholders. Pull in the process owner and at least two people who actually do the work.
- Gather the facts. Interview the team, watch the process happen if you can, and pull any existing tickets, forms, or logs.
- Map the main path first. Draw the way the job goes 80% of the time before touching exceptions.
- Add variations and decision points. Layer in what happens when a part is backordered or a customer reschedules.
- Mark every handoff. Anywhere work crosses from one role to another is where delays and errors concentrate.
Coursera’s guide to building a process map frames this as a five-step method: identify goal and scope, collaborate with participants, diagram the process, assess and get feedback, and test before rolling it out. That last step gets skipped constantly, and it’s the one that saves you from a redesign nobody wanted.
Before you call it done:
- Review the draft with the process owner and at least one frontline worker.
- Capture baseline numbers: how long the process currently takes, error rate, or number of handoffs.
- Run the revised map on one job, one route, or one team before rolling it out company-wide.
A lightweight swimlane and main-path map, piloted on a single crew, tells you more in two weeks than a perfect diagram sitting untested in a drawer.
How Do You Analyze a Map to Find Bottlenecks?
A map only earns its keep once you use it to find where time and quality get lost. Pull specific metrics onto the diagram: cycle time per step, wait time between handoffs, error or rework rate, and total number of handoffs. Asana’s guide to business process analysis frames this as a Define, Measure, Analyze, Improve, Control approach that produces both an as-is map and a to-be map, plus baseline KPIs to track against.
Once you’ve got the numbers, prioritize with a simple impact-versus-effort filter. Fix the quick wins first, the changes that take a day to implement and remove an obvious delay, then tackle the bigger structural fixes that need budget or a system change.
Governance keeps the improvement from evaporating:
- Assign one owner per map, not a committee.
- Version every update so old copies stop circulating.
- Set a review cadence, quarterly works for most trade processes.
- Build in a feedback loop so the people running the process can flag when it drifts from reality.
What Tools Should You Use to Build a Process Map?
Start as low-tech as the problem allows. A whiteboard and sticky notes will get you through a first draft with a room full of stakeholders faster than any software will.
- Whiteboard or paper: best for the first draft, especially with a group.
- Lucidchart or Miro: collaborative diagramming apps, good for remote teams building a swimlane or VSM together.
- Microsoft Visio: stronger for detailed, standardized diagrams and BPMN work.
- Atlassian Confluence or Jira: good for storing finished maps alongside SOPs, linking them to tickets, and controlling versions.
Templates for SIPOC, swimlane, and value stream maps exist inside most of these tools, so you rarely start from a blank canvas. Wherever you land, store the finished map somewhere the whole team can find it, and link it directly to training material or standard operating procedures instead of leaving it in someone’s personal folder.
What Mistakes Ruin a First Process Map?
The most common failure is mapping at Level 4 detail when Level 1 would have solved the problem. Over-detailed maps take weeks to build and get abandoned because nobody wants to update them.
- Don’t map without a stated purpose. It leads nowhere and nobody maintains it.
- Don’t skip validation with the people who actually do the work. Their reality rarely matches the process on paper.
- Do define scope before you draw a single box.
- Do assign an owner and a review date the day you finish the first draft.
Aim for the least detail that still answers the question you started with.
What Does a Real Trade-Business Process Map Look Like?
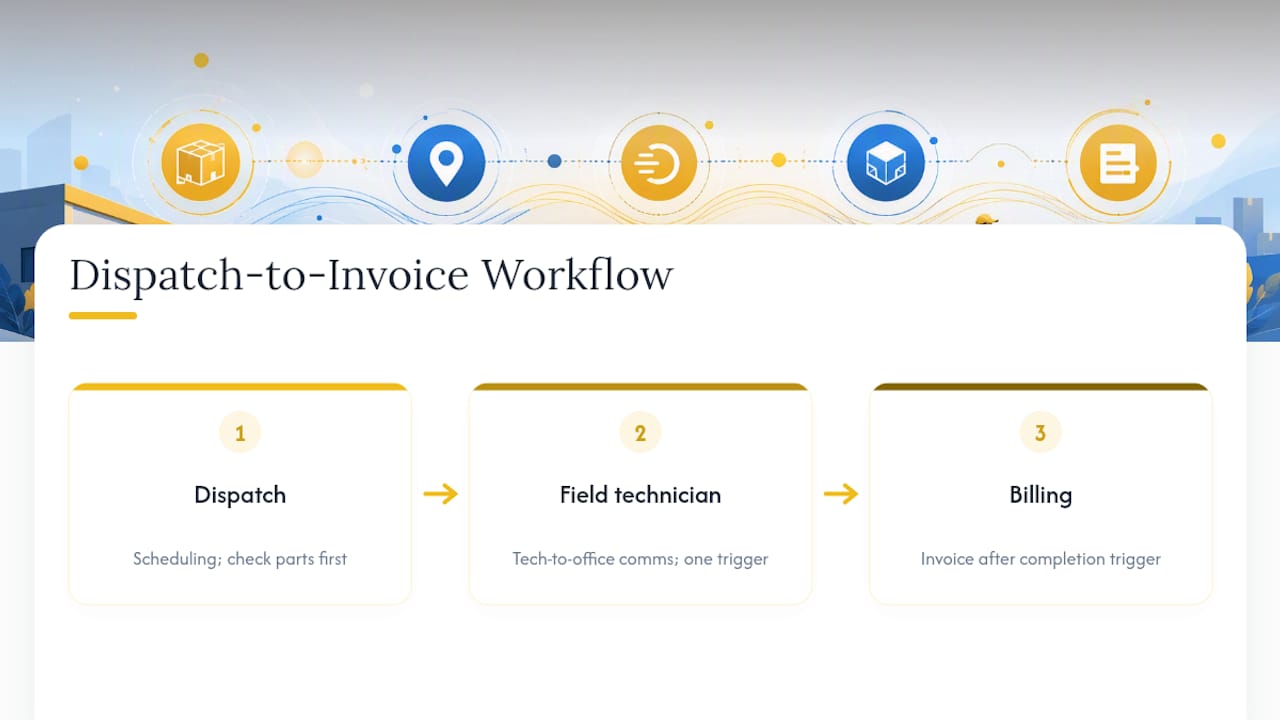
Picture a dispatch-to-job-completion workflow for a multi-trade contractor running HVAC, plumbing, and electrical crews under one roof. The scope ran from “customer call received” to “invoice sent,” with swimlanes for dispatch, field technician, and billing.
Mapping surfaced two handoff failures: dispatch was assigning jobs before checking parts availability, and technicians had no consistent way to flag a job as complete, which delayed invoicing by days. Fixing both meant adding a parts-check step before dispatch confirms a job, and a single completion trigger technicians use in the field.
Rebuildingthetrades has documented similar operational cleanups leading to measurable gains, including a client engagement tied to a substantial run rate and clearer financial visibility after tightening up dispatch and reporting workflows.
For trades specifically, the highest-value handoffs to map are almost always scheduling, parts flow, and technician-to-office communication.
Why Process Mapping Matters More Than It Gets Credit For
Most owners treat process mapping as a documentation chore instead of a diagnostic tool. It isn’t. A map done right exposes exactly where a dispatcher, a technician, and an invoice clerk are quietly working against each other without knowing it. The businesses that skip this step keep hiring their way out of problems that a single afternoon of mapping would have solved for free.
Turn Your Process Map Into an Operating System
A map tells you where the problems are. It doesn’t fix dispatch delays, untracked parts, or a technician who never gets the memo on scope changes. That’s where a consulting engagement pays for itself: Rebuildingthetrades takes the map you just learned to build and turns it into an actual operating rhythm, with KPI tracking, accountability systems, and hands-on leadership training built around your real workflow, not a generic template.

Rebuildingthetrades starts most engagements with the same kind of onsite audit and pilot approach covered above: fix one route or crew first, measure it, then scale. If you want to see how that process works in practice, look at the Tri-Trade case study or check current pricing for a consulting engagement built around your trade.
Where To Learn More About Process Mapping
- IBM’s overview of process mapping for definitions and notation guidance.
- Wikipedia’s business process mapping entry for the identify-gather-map-analyze-maintain method.
- Signavio’s process discovery guide for scope-setting best practices.
- See how mapping connects to implementation on Rebuildingthetrades’s process page.
Frequently Asked Questions
What is business process mapping in simple terms?
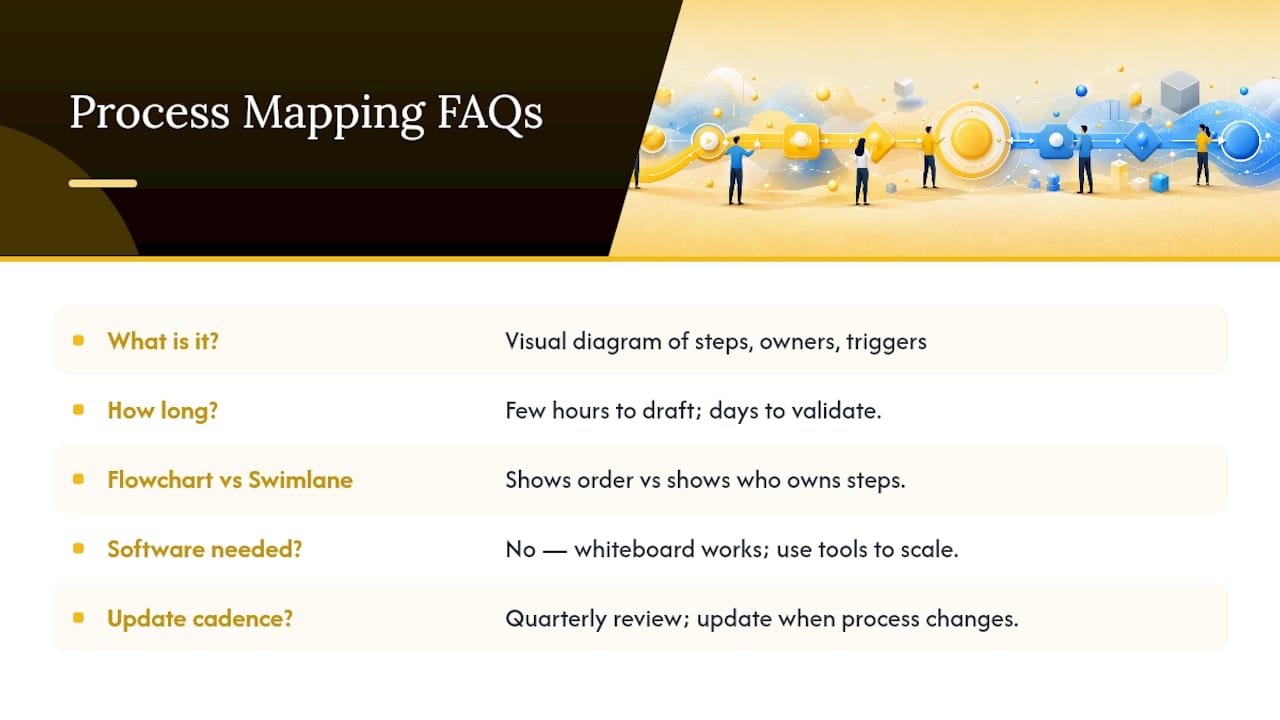
It’s a visual diagram of a workflow that shows the steps, who owns each one, and what triggers the start and end of the process.
How long does it take to map a business process?
A Level 1 or 2 map for a single workflow, like dispatch to invoice, usually takes a few hours with the right stakeholders in the room, plus a few days to validate.
What’s the difference between a flowchart and a swimlane diagram?
A flowchart shows the order steps happen in. A swimlane diagram adds who is responsible for each step, which matters the moment a process crosses more than one team.
Do I need special software to start business process mapping?
No. A whiteboard works for the first draft. Tools like Lucidchart, Microsoft Visio, or Miro help once you need to share, store, or scale the map.
How often should a process map be updated?
Review it on a set cadence, quarterly works well for most trade businesses, and update it any time the actual workflow changes, not just when someone remembers to.
Sources
- What is Process Mapping? | IBM
- Business process mapping – Wikipedia
- How to create a business process map – Coursera (article)
- Process mapping techniques: 8 methods compared (with 2026 decision guide) | Moxo
- Process Mapping: How to Map Business Processes? – SAP Signavio
0 Comments