
Track these eight numbers weekly and you will know more about your HVAC business than most owners ever learn: average ticket, gross margin per job, first-time fix rate, technician revenue per truck per day, callback rate, membership penetration, booked-call conversion rate, and AR days outstanding. Pick five to start. Review them every Monday morning for 15 minutes with your ops lead, and you will catch problems while they still cost hundreds of dollars instead of tens of thousands.
Most owners already collect this data somewhere, in ServiceTitan, in QuickBooks, in a dispatcher’s head. The problem is nobody turns it into a weekly habit. Industry benchmark guidance recommends growing companies watch a compact set of KPIs rather than a sprawling monthly report nobody reads past page two.
Here is how to start in the next 60 minutes:
- Pull last week’s completed job count and total revenue from your dispatch software to calculate average ticket.
- Export the last 90 days of service calls and tag each as “fixed on first visit” or “required a return trip.”
- Check your accounting software for accounts receivable aging, specifically anything over 30 days.
- Ask your CSR team how many booked calls converted to completed jobs last week.
- Build one spreadsheet or dashboard tab with these four numbers and commit to updating it every Friday afternoon.
That’s the whole starting move. No software purchase required, no consultant needed yet. Just a habit.
Table of Contents
- Financial KPIs Every HVAC Owner Must Track
- Operational and Field KPIs: Dispatch, Tech Productivity, and Job Quality
- Customer and Growth KPIs: Retention, Conversion, and Reputation
- Technical and System-Performance KPIs for Projects and Energy Outcomes
- How to Implement KPI Tracking: Systems, Cadence, Owners, and Data Quality
- Suggested Benchmarks and a Sample Dashboard Layout
- Calculation Formulas and Worked Examples
- Case Study: How KPIs Drove Measurable Improvement
- The One Rule That Keeps KPI Tracking From Collapsing
- How Rebuildingthetrades Helps HVAC Businesses Build and Run KPI Systems
- Key Takeaways — The Checklist to Act On Today
- Sources
Financial KPIs Every HVAC Owner Must Track
Financial HVAC KPIs tell you whether the business is actually making money or just staying busy. Revenue without margin is a treadmill, and plenty of HVAC companies run flat out for years without noticing they’re on one.
Average ticket is total service revenue divided by the number of completed jobs. A typical range runs $400 to $700 per residential service call, though replacement and install work pushes this much higher. If your average ticket sits below $400, your technicians likely aren’t presenting good/better/best options or add-on repairs consistently.
Gross margin per job equals (job revenue minus direct costs of labor and materials) divided by job revenue. SmartService’s benchmark data puts a typical gross margin per job at 40% to 55%, with best-in-class shops clearing 55% or better.
Net profit margin is net income divided by total revenue, calculated monthly or quarterly. Most healthy HVAC businesses land somewhere between 8% and 15% net margin after all overhead.
Operating cost ratio measures total operating expenses divided by total revenue. A target under 30% signals a lean overhead structure; above that, you’re likely overstaffed in the office or carrying too much unused fleet capacity.
AR days outstanding (DSO) tracks how long it takes to collect payment, calculated as (accounts receivable divided by total credit sales) multiplied by number of days in the period. Best practice targets under 30 days. Every extra week of DSO ties up cash you could otherwise use for payroll or new trucks.
Customer acquisition cost (CAC) is total marketing and sales spend divided by number of new customers acquired in that period. Lifetime value (LTV) estimates total revenue expected from a customer relationship, often calculated as average annual spend multiplied by expected years of retention. Reading CAC and LTV together tells you whether your marketing spend is sustainable.
| KPI | Formula | Struggling | Typical | Best-in-Class |
|---|---|---|---|---|
| Average ticket | Total revenue / completed jobs | Under $400 | $400 to $700 | Over $700 |
| Gross margin per job | (Revenue − direct costs) / revenue | Under 30% | 40% to 55% | 55%+ |
| Operating cost ratio | Operating expenses / revenue | Over 40% | 30% to 40% | Under 30% |
| AR days outstanding | (AR / credit sales) × days | Over 30 days | 30 days | Under 30 days |
According to Simpro’s HVAC KPI research, companies that track gross margin by job type, not just company-wide, catch profit leaks that blended averages hide entirely. A company doing 55% margin on maintenance but 25% on installs looks fine on paper until you split the numbers.
The fastest lever for most of these metrics is pricing discipline. Menu-based pricing with clear good/better/best tiers tends to lift average ticket without a single hard sales conversation. Tightening invoice cadence, billing same-day instead of end-of-week, usually shaves five to ten days off AR outstanding within a single quarter.
Operational and Field KPIs: Dispatch, Tech Productivity, and Job Quality
Operational KPIs answer a different question than financial ones: are your trucks and technicians actually being used well? A business can look financially fine this month while operational metrics quietly signal trouble two quarters out.
First-time fix rate (FTFR) equals the number of jobs completed without a return visit divided by total service calls. Typical FTFR runs 70% to 80%, with best-in-class shops hitting 80% or higher. Track this at both the technician level and the fleet level. A fleet average of 75% can mask one technician running at 60% because he’s under-stocked or under-trained.

Callback rate is the percentage of completed jobs that generate a return call within 30 days for the same issue.
Technician utilization, sometimes called billable-time percentage, divides billable hours by total paid hours. Top shops run technicians at 75% to 85% utilization.
Technician revenue per truck per day is a related but distinct number: total revenue generated divided by number of truck-days deployed. This has become one of the most-watched leading indicators in modern HVAC operations, because it captures both utilization and ticket size in one figure.
On-time arrival rate tracks the percentage of appointments where the technician arrived within the promised window. This one drives customer satisfaction scores more than almost any other operational metric, and it’s cheap to measure since most dispatch software logs it automatically.
Parts-on-truck completion rate measures the percentage of jobs completed using inventory already stocked on the truck, without a supply house run mid-job. Low FTFR and low parts-on-truck completion usually travel together.
Pro Tip: *Audit your top three service categories (say, capacitor replacement, igniter failure, and blower motor issues) and stock trucks against actual call history, not a generic parts list.
When FTFR drops, check these in order:
- Inventory mismatch between what’s stocked and what’s actually needed for common repairs.
- Diagnostic training gaps, especially among technicians hired in the last six months.
- Dispatch software routing the wrong skill level to complex jobs.
- Parts quality issues from a specific supplier causing repeat failures.
When technician productivity drops, look at route density first. A technician doing four jobs across 60 miles of driving looks unproductive on paper but might just be poorly dispatched, not poorly performing.
Customer and Growth KPIs: Retention, Conversion, and Reputation
Customer KPIs measure whether people keep choosing you, and whether your team converts the calls that come in. These numbers predict revenue six months to two years out, which makes them easy to ignore in the short term and expensive to ignore long term.
Service agreement (membership) attach rate is new memberships sold divided by total eligible service calls in a period. Renewal rate measures the percentage of members who renew at the end of their term. Top-performing shops treat membership penetration as a leading indicator they review weekly, not quarterly, because member households generate far more predictable repeat revenue and higher replacement conversion.
Booked-call conversion rate divides completed jobs by total booked calls. Strong operations exceed 85% booked-call conversion. Anything meaningfully lower suggests a scheduling or no-show problem worth solving before you spend another dollar on marketing.
Close rate for sales-driven work, replacements and larger repairs, tracks proposals accepted divided by proposals presented.
Review rate measures the percentage of completed jobs that generate a public review, typically tracked monthly across Google and other platforms your CSR team monitors.
Net Promoter Score (NPS) and Customer Satisfaction Score (CSAT) both come from a short post-job survey. A single-line NPS question works well embedded in your invoice email: “On a scale of 0 to 10, how likely are you to recommend us to a friend or neighbor?” Place it in the automated follow-up email sent within 24 hours of job completion, while the visit is still fresh.
The businesses that treat membership penetration and revenue per truck as numbers to check weekly, not once a quarter, catch the small dips before they become a bad month. The ones that only look monthly find out too late.
CSR scripts move booked-call conversion faster than almost any other lever: a scripted confirmation call the day before, plus a same-day reminder text, cuts no-shows meaningfully. Membership tiers with clear pricing (good, better, best coverage levels) lift attach rate without requiring a hard upsell pitch. Review the customer-facing KPIs monthly alongside marketing spend, but check booked-call conversion and on-time arrival weekly since they move fast and compound daily.
Technical and System-Performance KPIs for Projects and Energy Outcomes
Component ratings and system-level KPIs measure two different things, and confusing them is one of the more expensive mistakes in HVAC project work. A high SEER2 rating on a piece of equipment tells you almost nothing about how that system performs once it’s installed, ducted, and running under real load.
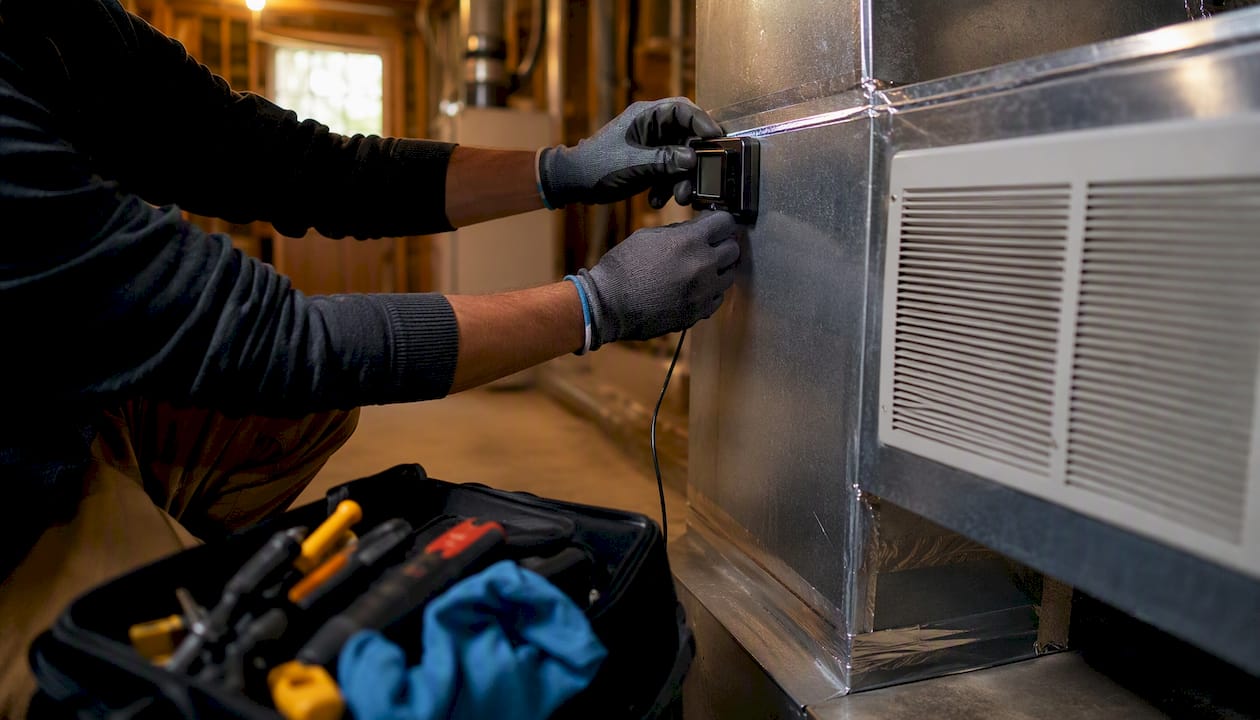
SEER2, EER2, HSPF2, AFUE, and COP are all component-rated efficiency figures, measured under standardized lab conditions. These ratings changed with recent DOE testing procedure updates, and they describe equipment potential, not delivered performance. A unit rated at 16 SEER2 installed with poor duct sealing, wrong refrigerant charge, or a mismatched air handler can perform far below its rated number in the field.
System-level KPIs measure what actually happens after installation:
- Delta-T (ΔT), the temperature difference between supply and return air, confirms whether a system is delivering rated capacity on-site. Typical target range for cooling is 16 to 22 degrees Fahrenheit, though this varies by climate and humidity.
- kW/ton in operation measures actual electrical draw against actual cooling delivered, a real-world efficiency figure that often diverges from the nameplate rating.
- IPLV (Integrated Part-Load Value) estimates efficiency across a range of operating loads rather than a single test point, useful for equipment that runs at partial capacity most of the time.
- TSPR (Total System Performance Ratio) compares annual heating and cooling load to annual energy consumed by the entire system, capturing distribution losses and control behavior that component ratings miss entirely.
Engineers behind the TSPR methodology argue that system-level metrics catch problems, oversized ductwork, poor controls sequencing, part-load inefficiency, that component ratings simply can’t see. TSPR has been adopted as a performance-based compliance path in the Washington State Energy Code, giving contractors and building owners a code-recognized alternative to prescriptive equipment-only compliance.
Measurement notes matter here. ΔT readings taken during a mild shoulder-season day will mislead you; take them during peak load conditions whenever possible. Sensor placement matters too: return air sensors placed too close to a return grille pick up infiltration air rather than true conditioned space temperature. Expected benchmark ranges also shift by building type, since energy intensity per square foot varies significantly across commercial building categories, so a kW/ton figure that looks strong in a small office might look weak in a hospital with heavier ventilation loads.
| Metric type | Examples | What it measures | Use case |
|---|---|---|---|
| Component rating | SEER2, EER2, AFUE, COP | Lab-tested equipment potential | Equipment selection, code compliance minimums |
| System performance | ΔT, kW/ton, IPLV | Real-world delivered efficiency | Commissioning, troubleshooting, quality control |
| Building-level | TSPR | Annual load vs. annual energy consumed | Code compliance path, whole-system evaluation |
How to Implement KPI Tracking: Systems, Cadence, Owners, and Data Quality
Implementing HVAC KPIs fails most often not because the metrics are wrong, but because nobody owns them and the source data is messy. Get the data foundation right before you build a single dashboard.
Start with these data sources:
- Dispatch and CRM software (ServiceTitan, Housecall Pro, or similar) for job counts, ticket size, and technician assignment data.
- Accounting software (QuickBooks or similar) for revenue, cost of goods sold, and AR aging.
- Inventory or parts management system for stock levels and parts-on-truck tracking.
- Field telematics or GPS tracking for route efficiency and on-time arrival data.
- A simple post-job survey tool for NPS and CSAT capture.
The minimal dataset to start needs only three things: job-level revenue and cost, technician assignment per job, and completion status (first-visit-complete or callback). Everything else builds on top of that foundation.
Build your dashboard in three layers:
- Daily view: jobs completed, on-time arrival rate, any callback flagged that day. Five minutes, reviewed by the dispatch lead.
- Weekly view: average ticket, FTFR, technician revenue per truck/day, booked-call conversion, AR days outstanding. Fifteen to thirty minutes, reviewed by ownership and ops management together.
- Monthly view: gross margin by job type, net profit margin, membership penetration and renewal rate, NPS trend, CAC and LTV. Reviewed in a leadership meeting with department heads.
Assign one owner per KPI category, not one owner for everything. Your ops manager owns FTFR and callback rate. Your office manager owns AR days and invoicing cadence. Your marketing lead owns CAC, booked-call conversion, and review rate. Ownership without a name attached rarely survives past the second week.
Set a recurring 15 to 30 minute weekly meeting focused only on exceptions, the KPIs that moved outside their normal range, not a full read-through of every number. Shorter, more frequent governance meetings tend to drive faster corrective action than a long monthly report that arrives after the problem has already compounded.
Suggested Benchmarks and a Sample Dashboard Layout
Benchmarks only mean something in context, so treat every range below as a starting point to calibrate against your own market, not a universal law.
For a weekly ops view, highlight FTFR, average ticket, technician revenue per truck/day, callback rate, and on-time arrival rate. These five move fast enough week to week that they’re worth a dedicated look every Monday, and they’re the ones most directly tied to what happened in the field last week.
For a monthly leadership view, shift focus to gross margin by job type, net profit margin, membership penetration and renewal, NPS trend, and CAC/LTV together. These numbers move slower and matter more for strategic decisions, pricing changes, hiring, marketing budget shifts, than day-to-day firefighting.
Simple alert rules keep the dashboard from becoming noise:
- If callback rate exceeds 5% for two consecutive weeks, trigger a technician-level review and a parts audit.
- If AR days outstanding exceeds 40, trigger a review of invoicing cadence and collections follow-up.
- If booked-call conversion drops below 80% for a week, trigger a CSR script review and no-show analysis.
- If technician revenue per truck/day falls 15% below the fleet average, trigger a route density and dispatch review.
The business impact of each alert differs. A callback spike costs you technician hours and reputation. An AR slip costs you cash flow flexibility. A conversion dip costs you revenue you already paid to generate through marketing. Weight your response speed accordingly.
External factors shift these benchmarks too. Weather swings and seasonal demand mean a callback rate that looks alarming in the first heat wave of summer might just reflect a surge of rushed diagnostic visits during peak call volume, not a training problem. Adjust your alert thresholds seasonally: expect FTFR to dip slightly during your busiest month and don’t panic over a single week that coincides with a heat advisory or a cold snap.
Calculation Formulas and Worked Examples
Here are the core formulas in one place, followed by worked examples you can drop straight into a spreadsheet.
- FTFR = (jobs completed on first visit) / (total service visits) × 100
- Average ticket = total service revenue / number of completed jobs
- Gross margin per job = (job revenue − direct labor and material cost) / job revenue × 100
- Technician revenue per truck/day = total revenue generated / number of truck-days
- Callback rate = (jobs requiring a return visit within 30 days) / (total completed jobs) × 100
- Membership attach rate = (new memberships sold) / (eligible service calls) × 100
- CAC = total marketing and sales spend / new customers acquired
Worked example 1: Service job. A technician completes a repair, charging $520 for the visit. Parts cost $95, and labor cost (loaded, including burden) runs $140. That sits right at the top of the typical range and close to best-in-class.
Worked example 2: Replacement install. A system replacement is sold for $9,800. Equipment cost is $5,200, and labor plus permit costs run $1,100. Lower than the service-job margin, which is normal for install work, but worth tracking separately since blending it with service-call margins hides the difference.
Worked example 3: Membership cohort. Out of 400 eligible service calls in a month, your CSR team sold 68 new memberships.
For spreadsheet structure, keep raw data in one flat table: date, job ID, technician, job type, revenue, cost, completion status. Build your KPI calculations in a separate summary tab that pulls from that raw table using SUMIFS and COUNTIFS formulas. To compute a rolling 13-week average for any KPI, use an AVERAGEIFS formula referencing a date range that shifts each week, or build a simple rolling window with =AVERAGE(OFFSET(cell,-12,0,13,1)) anchored to your latest week’s column.
Case Study: How KPIs Drove Measurable Improvement
A three-location HVAC and plumbing operation running roughly a dozen trucks came into a consulting engagement with a familiar set of symptoms: strong revenue on paper, thin cash reserves, and no one able to say with confidence which trucks or technicians were actually profitable.
Baseline metrics told the real story. Technician revenue per truck/day varied wildly between locations, and nobody had visibility into gross margin by job type since the accounting system blended everything into one revenue line.
The engagement started with a scorecard build: five weekly KPIs (FTFR, average ticket, technician revenue per truck/day, callback rate, and AR days outstanding) tracked in a shared dashboard, reviewed every Monday in a 20-minute standing meeting. Dispatch routing was restructured to reduce windshield time between calls, and pricing was rebuilt around a three-tier menu system instead of ad hoc quoting.
Once ownership could see the number behind every truck, every week, the conversations in the Monday meeting changed completely. Instead of arguing about feelings, the team argued about which specific job type was dragging margin down, and fixed that instead.
Average ticket rose from roughly $380 to $540 with the new menu pricing structure in place. AR days outstanding dropped from 52 to 28 after the team moved to same-day invoicing. Documented results from a similar Rebuildingthetrades engagement point to the same pattern: operational clarity and a consistent weekly scorecard tend to precede the financial gains, not follow them.
The takeaway for owners considering outside help: bring in a consultant when you have the data but lack the discipline or bandwidth to build the scorecard and run the weekly governance meeting consistently. Bringing in help before you have any baseline data usually wastes the first month just building what you could have built yourself.
The One Rule That Keeps KPI Tracking From Collapsing
Track fewer numbers, more often, or you’ll end up tracking nothing at all. That’s the rule. Owners who build a 40-metric dashboard in the first month almost always abandon it by month three, because nobody has time to review 40 numbers every week and still run a business.
It works because attention is the actual scarce resource here, not data. Data is nearly free now; every dispatch platform and accounting tool spits out more numbers than any owner can act on. What’s expensive is the discipline to sit down every single week and ask “what changed, and why?” about five or six things instead of glancing past forty things. A five-KPI weekly habit that survives twelve months beats a forty-KPI dashboard that survives six weeks.
Bend the rule only once the five-KPI habit is fully automatic, meaning your team pulls the numbers without being asked and the Monday meeting runs itself. At that point, add a sixth or seventh metric, usually something more forward-looking like membership penetration or CAC trend, rather than swapping out one of the original five. Most owners who fail at KPI tracking don’t fail from picking the wrong metrics. They fail from picking too many, too soon, and burning out the habit before it takes hold.
How Rebuildingthetrades Helps HVAC Businesses Build and Run KPI Systems
Reading a KPI list is one thing. Building the dashboard, training your team to update it, and running a weekly meeting that actually changes behavior is a different job entirely, and it’s the one most owners never get around to finishing.

Rebuildingthetrades works directly inside HVAC businesses to build that system from the ground up: onsite audits that establish your real baseline numbers, custom dashboard builds pulling from your existing dispatch and accounting software, and weekly operating rhythm facilitation so the Monday meeting happens whether or not you remember to schedule it. This isn’t generic business coaching, it’s hands-on work with trade businesses specifically, which means the KPI definitions, benchmarks, and dashboard layouts are built around how HVAC, plumbing, and electrical operations actually run.
The signal that you need this kind of help usually shows up as a gap between effort and results: your team is busy, your trucks are rolling, and you still can’t say with confidence why margin dipped last quarter. Engagements typically run as multi-month advisory work, starting with an audit and scorecard build, then shifting into ongoing accountability and leadership training as the numbers stabilize. If that gap sounds familiar, Rebuildingthetrades’s pricing and engagement structure is the place to see what a KPI-focused engagement actually looks like for a business your size.
Key Takeaways — The Checklist to Act On Today
Tracking five to eight core HVAC KPIs weekly, with clear owners and a consistent review cadence, is what separates businesses that grow profitably from ones that stay busy without getting ahead.
| Point | Details |
|---|---|
| Start with five KPIs | Pick FTFR, average ticket, technician revenue per truck/day, callback rate, and AR days outstanding for week one. |
| Fix data hygiene first | Confirm job-level revenue, cost, and completion status are captured accurately before building any dashboard. |
| Assign one owner per category | Ops manager owns field metrics, office manager owns financial metrics, marketing lead owns growth metrics. |
| Run a 90-day sprint | Weeks 1 to 2 build the scorecard, weeks 3 to 8 run weekly reviews and fix root causes, weeks 9 to 13 add monthly financial KPIs. |
| Bring in outside help when stuck | Rebuildingthetrades builds the dashboard and runs the weekly governance meeting when internal bandwidth runs out. |
Sources
- Key KPIs for HVAC Businesses | Track What Matters Most
- HVAC KPIs: 26 Metrics to Track Profit & Growth
- HVAC System Performance for Energy Codes Technical Brief
- Use of energy in commercial buildings – EIA
0 Comments