
A compact contractor scorecard tracks a handful of leading indicators and a few lagging checks, reviewed in a 15 minute weekly meeting with a named owner for every number. Start today: pick five leading indicators, assign one owner for each, and run your first Monday 15 minute review before the week is out.
TL;DR:
- Leading measures such as toolbox participation and completed inspections deserve more weight than injury counts or callbacks, which record problems after they occur.
- Keep field forms under five minutes, compare rates per crew hour rather than raw counts, and spot audit entries monthly to catch reporting errors.
- Keep Monday’s 15 minute review to numbers and seven day actions; discuss root causes separately, and escalate metrics off track for two consecutive weeks.
- Use a shared spreadsheet during the first 6–12 weeks; adopt paid field software only after weekly entry is consistent and the team trusts its data.
Table of Contents
- Which metrics actually belong on a trade scorecard
- How to collect and normalize field data so the numbers mean something
- Running the review rhythm: 15 minutes weekly, longer monthly and quarterly
- A sample scorecard template you can copy this week
- Why a short rhythm beats a complicated system
- How we help you stand up scorecards that actually get used
- FAQ
- Sources
Which metrics actually belong on a trade scorecard
Leading indicators measure the activities that prevent problems before they happen: toolbox talks held, inspections completed, near-misses reported. Lagging indicators measure what already went wrong: injury counts, callbacks, missed deadlines. OSHA’s leading indicators guidance makes the case that leading measures are proactive and should carry more weight on a scorecard than lagging numbers alone, because by the time a lagging indicator moves, the damage is already done.
A workable scorecard mixes both, weighted toward leading metrics:
- Safety leading indicators: toolbox talk participation rate, job hazard analysis (JHA) completion rate, near-miss reports filed, safety observations logged.
- Productivity: percent billable hours per tech, jobs completed per tech-day.
- Quality: callback rate per 100 jobs, first-time fix rate.
- Schedule: schedule variance (actual versus planned completion).
- Subcontractor reliability: on-time arrival rate, change order rate, corrective actions still open.
Each number tells you something specific. A dropping toolbox talk participation rate usually shows up a few weeks before a jump in near-misses. A falling first-time fix rate often points to a parts-stocking problem or a training gap on a specific crew. Rising open corrective actions on a subcontractor is an early warning that a relationship needs a conversation before it needs a replacement. None of these numbers matters in isolation: the value comes from watching the trend, week over week, against the same crew and the same job type.
How to collect and normalize field data so the numbers mean something
Raw counts lie. Ten near-misses on a 40-person crew is a different story than ten near-misses on a 4-person crew, and a number pulled once a month tells you almost nothing about a trend. The fix is disciplined capture plus normalization.
- Capture data at the source with a short mobile form, QR-code sign-in sheet, or a foreman quick-check that takes 2 to 5 minutes, never longer.
- Normalize every count against crew-hours or crew size before you compare it to another crew or another week.
- Spot-audit a sample of entries monthly, with photo evidence where practical, to catch sloppy or inflated reporting early.
OSHA’s recommended practices guide for leading indicators walks through this exact sequence: pick the indicator, set a goal, collect the data, graph it, then act on what the trend shows. The same source recommends keeping field forms short and mobile-first, since participation drops fast once a form takes more than a few minutes to complete.
Normalization is simple arithmetic. Report near-misses as (count ÷ crew-hours) × 1,000, so a crew working 2,000 hours a month with 3 near-misses reports 1.5 per 1,000 hours, a number you can compare fairly against a bigger or smaller crew. Report toolbox participation as attended crew members divided by crew roster, times 100.
Pro Tip: Run the same normalization formula every week, even when the raw numbers look fine. The trend line is the point, not any single week’s result.
Running the review rhythm: 15 minutes weekly, longer monthly and quarterly
A scorecard that nobody reviews is a spreadsheet nobody reads. The fix is a fixed cadence with a short, strict agenda, something program evaluation guidance from OSHA backs up directly: keep the weekly check to 15 minutes, Monday morning, numbers only.
- Weekly, 15 minutes, Monday: review the numbers, flag what is off-track, assign an owner and a 7-day action, update the corrective-action log.
- Monthly, 45 to 60 minutes: step back from single weeks and look at trend lines across crews and trades.
- Quarterly: a leadership-level review that ties scorecard trends to staffing, training budgets, and subcontractor decisions.
Keep the weekly meeting narrow on purpose. It is not the place for coaching conversations or root-cause debates: those belong in a separate one-on-one, where there’s time to dig in. The weekly stand-up exists to catch drift early and put a name and a deadline on every item that needs one.
Every weekly review should produce three things: a short list of recorded actions with owners, a one-page trend snapshot anyone on the leadership team can scan in under a minute, and a clear escalation rule for anything that shows up off-track two weeks running. Recognize the crews and subs whose numbers are trending the right way. It costs nothing and it reinforces that the scorecard is a tool for improvement, not just a compliance exercise.
A sample scorecard template you can copy this week
A single sheet, one row per crew per week, works for most trade businesses starting out. Use these columns:
- Date, crew ID, trade, project or job site, total crew-hours.
- Toolbox talk participation percent, JHA completion percent.
- Near-miss count per 1,000 hours, safety observations per 100 hours.
- Inspections completed, corrective actions open and past-due.
- Percent billable hours, callbacks per 100 jobs, schedule variance percent.
Compute the rate columns the same way every time: near-misses per 1,000 hours is (count ÷ crew-hours) × 1,000, and toolbox participation is attended ÷ roster × 100. Consistency matters more than precision here.
Set two simple threshold rules to color-code each cell: green when a metric is at or better than target, amber when it has slipped but corrective action is already assigned, and red when it is off-track with no owner or no plan. A common starting target, drawn from OSHA’s stepwise guidance, is keeping past-due corrective actions low month over month.
Start this in a shared spreadsheet or a lightweight field app. It is enough for the first 6 to 12 weeks while you stabilize the habit of weekly entry and review. Our scorecard versus dashboard comparison walks through when a simple weekly scorecard stops being enough and a broader dashboard earns its place. Once weekly entry is consistent and the team trusts the numbers, a paid field tool for job and crew tracking, such as the kind covered in this crew productivity tracking guide, becomes worth the cost.
Why a short rhythm beats a complicated system
Most trade businesses that try scorecards fail for the same reason: they build something too detailed to maintain, so it gets updated sporadically and nobody trusts the numbers by month three. The businesses that stick with it keep the sheet simple and protect the weekly 15 minute habit like it is a client appointment, because it is.
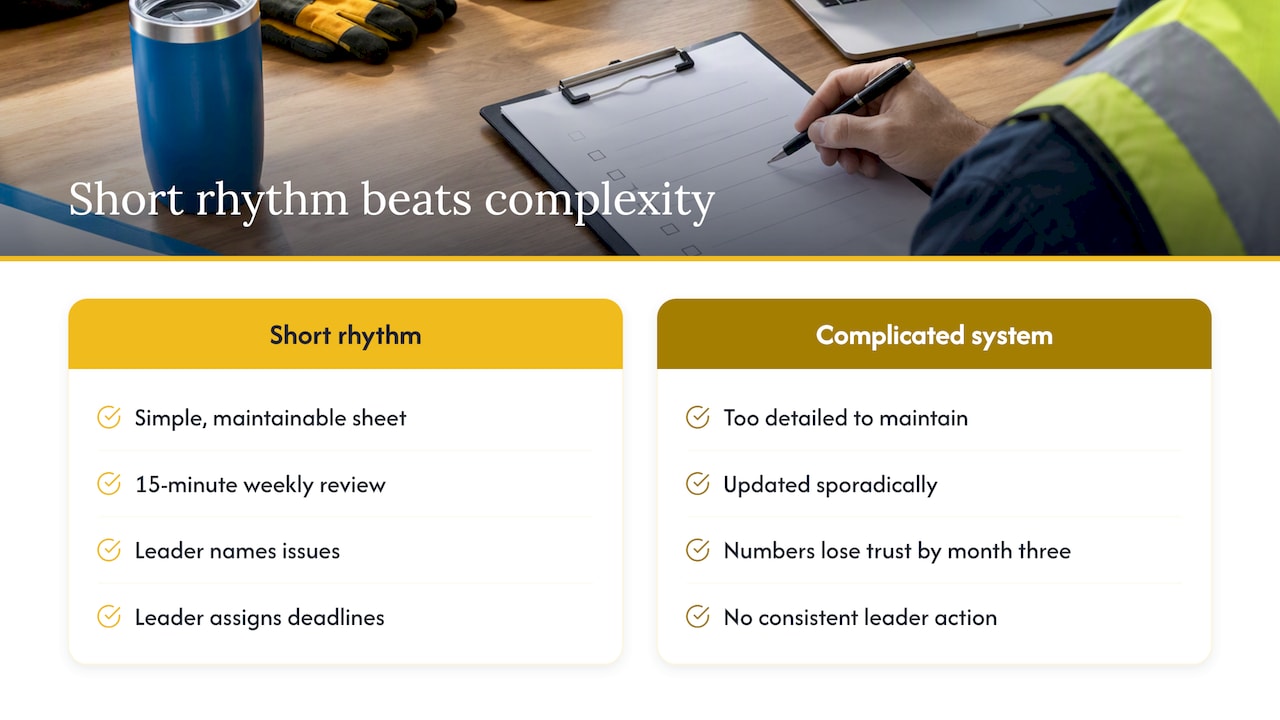
We have seen this pattern play out directly in our own client work. Businesses that paired a simple weekly scorecard rhythm with hands-on leadership coaching closed corrective actions faster and reported clearer operational visibility. The scorecard itself is not what changes behavior. The habit of a leader looking at the same numbers every Monday, naming what is off, and assigning a deadline is what changes behavior. Pair that weekly operational rhythm with a short financial check, like a weekly cash flow rhythm, and a leadership team gets a full picture of the business in under an hour a week combined.
Field data only becomes useful once someone with authority acts on it consistently. That is the gap most scorecards fall into.
— Dan
How we help you stand up scorecards that actually get used
We build and run the first 30 to 90 days of a scorecard rhythm with you, so you are not guessing at thresholds or chasing a spreadsheet nobody updates. Our hands-on work covers:
- Setting up the scorecard fields and thresholds specific to your trade and crew structure.
- Training supervisors and foremen to capture field data consistently in under five minutes a form.
- Running the first several weekly reviews alongside your leadership team until the rhythm sticks on its own.

This work sits inside our broader Rebuild engagement, where scorecards pair with leadership training and accountability systems built specifically for trade businesses, not generic templates borrowed from another industry. If you want to see what a pilot costs for your crew size and trade mix, our pricing page lays out engagement options, or you can reach out directly through our site to start the conversation this week.
FAQ
What is the difference between leading and lagging indicators?
Leading indicators measure proactive activities, like toolbox talks or inspections completed, that happen before a problem occurs. Lagging indicators, like injury counts or callback rates, measure outcomes after the fact, and OSHA’s guidance recommends weighting a scorecard toward leading measures so issues surface earlier.
How many metrics should a contractor scorecard include?
Most trade businesses start with 4 to 6 leading indicators and 1 to 2 lagging checks, which is enough to catch drift without overwhelming a weekly 15 minute review. Adding more metrics than a team can review consistently each week tends to break the habit rather than improve it.
How long should a weekly scorecard review meeting take?
A weekly scorecard review should run about 15 minutes, typically first thing Monday, covering only the numbers, what is off-track, and who owns the next action. Coaching conversations and root-cause discussions belong in a separate meeting, according to OSHA program evaluation guidance.
How do you normalize scorecard data across different crew sizes?
Rate metrics per crew-hour rather than reporting raw counts, for example (near-miss count ÷ crew-hours) × 1,000, so a small crew and a large crew can be compared fairly. OSHA’s recommended practices walk through this normalization approach alongside goal-setting and trend tracking.
When should a contractor move from a spreadsheet to a paid field app?
A shared spreadsheet or lightweight field app works fine for the first 6 to 12 weeks while a business builds the habit of consistent weekly entry and review. Once that rhythm is solid, a dedicated field productivity tool, such as the methods covered in this crew productivity tracking guide, can take over the heavier data collection.
0 Comments