
Capacity planning for an HVAC contractor means one thing: knowing how many installs and service calls your crews can finish in a week, then selling and scheduling to that number. You count productive person-hours, not payroll hours, divide by how long each job type really takes, and hold back a buffer. This is different from sizing a system for a house, which is a load calculation. We run the business-side math below, with an example you can copy, and show where owners usually get it wrong.
If your install schedule swings between a three-week backlog and idle crews, the cause is rarely a lack of effort. It is usually that nobody owns the number that says what the shop can actually deliver. Rebuilding the Trades works on exactly that kind of operational gap in trade businesses, including dispatch and scheduling.
TL;DR
- Capacity is productive person-hours divided by measured hours per job, not headcount times 40.
- Install capacity is counted in person-hours: a two-person crew on a 10-hour job uses 20 person-hours.
- Use your own completed-job history for durations, and round bookable jobs down.
- Keep a buffer for slippage, callbacks and emergency calls, and never book to 100%.
- A backlog that stays long in every season is a signal to fix the system first, then decide on hiring.
Table of Contents
- Capacity planning versus system sizing
- Step 1: Count productive hours, not paid hours
- Step 2: Measure how long each job type really takes
- Step 3: Convert hours into bookable jobs
- Step 4: Hold a buffer and an emergency reserve
- Step 5: Match demand to capacity every week
- Step 6: Track the numbers that show strain early
- When the numbers say hire, and when they say fix the system
- Where capacity plans break
- Our perspective
- Put the plan into practice with us
- FAQ
- Sources
Capacity planning versus system sizing
Search results for this phrase are crowded with equipment sizing: tonnage, BTUs, square feet per ton. That is a different problem. A Manual J report calculates a building’s heating and cooling loads, while equipment capacity is how much heating or cooling a unit can supply. It tells you which unit goes in a home.
Business capacity planning asks a different question: how much of that work can your company deliver, with the people and trucks you have, without wrecking quality or margin? It covers installs, service calls, maintenance agreements and the time you reserve for emergencies. It is what decides whether you say yes to the next replacement job in the third week of July.
Step 1: Count productive hours, not paid hours
Start with the people who actually turn wrenches. For each crew, list the technicians, paid hours per day and working days per week. That is your gross number.
Now take out the time that is paid but not billable:
- Time off, training and shop days.
- Loading the truck, pulling materials, supply house runs.
- Breaks and lunch.
- Paperwork, photos, closeout notes.
- Drive time between jobs, if you do not count it inside each job.
What is left is productive capacity. Owners who skip this step run on a calendar fantasy. Eight paid hours on a service truck rarely become eight hours at a customer’s home. Your own start-and-finish timestamps will show the real ratio. If you have no data yet, begin with an assumption in the 70 to 85% range, label it as an assumption, and replace it with your own numbers after a month of tracking.
One point on who is in the count. A new helper and a lead installer do not produce the same output, and a technician who cannot yet run a service call alone cannot be counted as a service slot. Check what qualifications and skills your field staff actually hold before you assign them to a job type, and count only the hours a person can fill unsupervised.
Step 2: Measure how long each job type really takes
One blended average job length is the most common mistake. A tune-up, a diagnostic, a straight swap and a full system with new ductwork are different products with different durations. Pull the last 60 to 90 days of completed jobs and calculate the average on-site time for each type.
Two cautions:
- Use actual time on site, not the block on the calendar. Calendar blocks often include padding for travel. If you subtract travel again from capacity, you count it twice and understate what the crew can do.
- Install time varies more than most owners plan for. One contractor guide puts a straightforward swap at 4 to 8 hours and jobs with new ductwork, electrical upgrades or multi-zone systems at 1 to 3 days. The same source lists access, permits and inspections, workload, season and weather among the drivers. Treat those numbers as a reminder of the spread, and let your own history set your durations.
Sort your install history into at least three buckets: like-for-like swaps, swaps with ductwork or electrical changes, and full new systems or multi-zone. Add a fourth for anything you do in occupied commercial space if it applies.
Step 3: Convert hours into bookable jobs
The core math is short.
- Productive hours = crew size × paid hours per day × days × utilization.
- Bookable jobs = productive hours ÷ person-hours per job.
- Round down.
Installs must be counted in person-hours, not elapsed days. A two-person crew working a 10-hour install consumes 20 person-hours, and if you plan it as “one install per day” you will think a six-person group can do far more than it can.
Worked example: an install department
These numbers are illustrative, not a benchmark.
- Three two-person install crews: 6 installers.
- 8 paid hours a day, 5 days: 240 paid person-hours a week.
- Utilization assumption of 75%: 180 productive person-hours.
- Average like-for-like swap: 20 person-hours.
That is 9 swaps a week before any buffer. Hold back about 12% for slippage and callbacks, which leaves roughly 158 hours, or 7.9 swaps. Round down: sell 7 swaps a week, not 9. If one of those weeks includes a ductwork-heavy job at 40 person-hours, it takes the place of two swaps, and your promise to the next customer changes with it.
Worked example: a service truck
- One technician, 8 paid hours.
- 85% of the day is available after loading, breaks and admin: 6.8 hours.
- Average service call: 1.25 hours on site plus 0.5 hours of drive time, so 1.75 hours.
6.8 ÷ 1.75 is 3.9, so schedule 3 calls per truck per day, and keep the remainder as flex for a run that goes long. Do the same math separately for diagnostics, maintenance and estimates. A maintenance visit and a no-cool diagnostic should never share one average.
Step 4: Hold a buffer and an emergency reserve
A schedule booked to 100% of theoretical capacity is a schedule that is already late. Equipment arrives wrong, an attic access is worse than the photos, a permit inspection slips. A buffer of 10 to 15% of capacity is a practical range to start with, then tighten it using your own variance data.
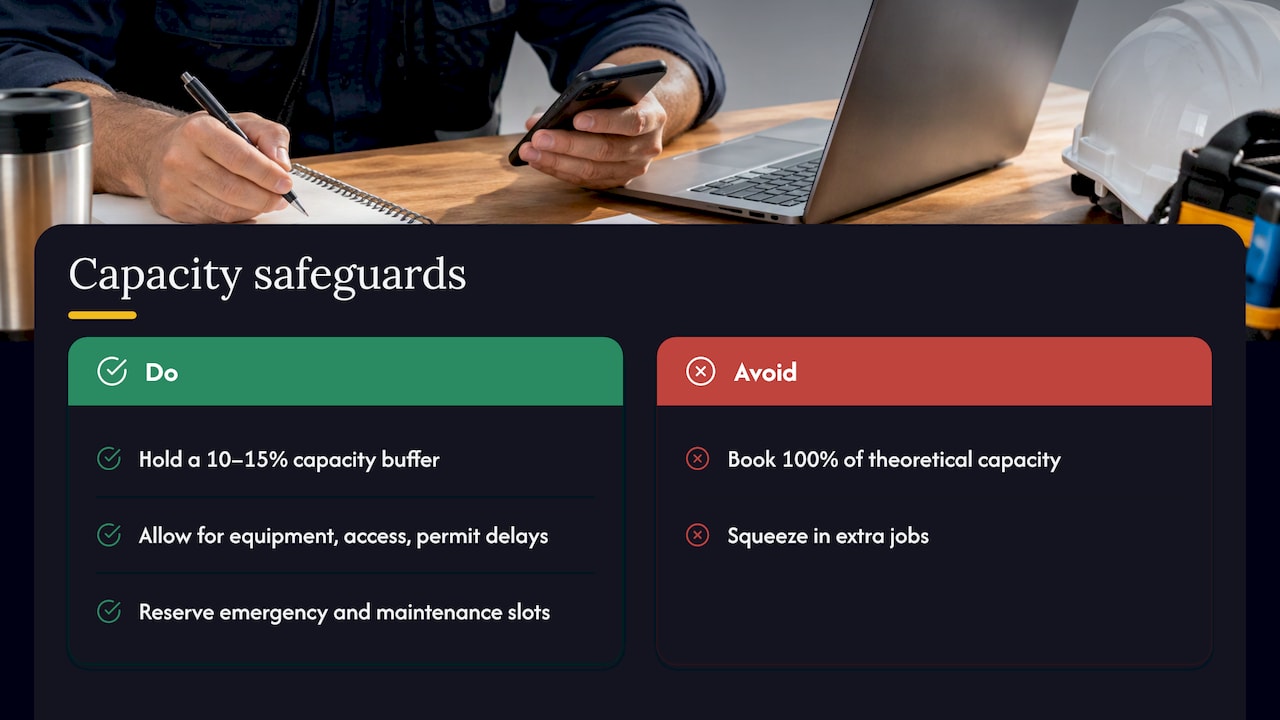
For service, reserve slots for same-day emergencies and for the maintenance visits you have already committed to. Overloaded schedules show up as missed emergency calls, rushed diagnostics, callbacks and lost commercial bids. Every one of those costs more than the revenue from the extra job you squeezed in. If callbacks are part of your problem, the commissioning process matters as much as the schedule, because a clean first install returns hours to capacity.
Step 5: Match demand to capacity every week
Capacity planning only works when it meets a demand forecast. Once a week, put three numbers side by side for the next four to six weeks:
| Item | What to pull | Where it comes from |
|---|---|---|
| Confirmed work | Signed installs and booked maintenance, in person-hours | Your job system or sold-work list |
| Probable work | Open estimates times your close rate, in person-hours | Sales pipeline |
| Available hours | Productive hours less buffer and time off | Your capacity calculation |
If confirmed plus probable work exceeds available hours, you have four options: move start dates and tell the customer early, slow intake by raising the price or lengthening quoted lead time, bring in a qualified partner for the overflow, or add labor. If available hours exceed demand, the fix is on the front end: sales follow-up, call handling, and maintenance agreement sales. Your close rate and your phone handling decide how fast empty hours fill.
The pricing lever is underused. A service rate increase is a capacity tool as much as a margin tool, because it filters demand to the work your crews can profitably deliver.
Step 6: Track the numbers that show strain early
A short dashboard is enough. Review these weekly:
- Labor utilization: billable hours divided by paid hours, by crew. Above roughly 90% there is almost no room to flex; somewhere in the 75 to 85% range there usually is.
- Job cycle time: from start to complete, by job type.
- Schedule adherence and on-time arrival.
- Backlog: approved work waiting to be scheduled or done, in days. One contractor guide suggests treating a service backlog of three or more days in shoulder seasons, or five to seven days in peak summer or winter, as a signal worth acting on.
- Gross margin by job type. Capacity is not worth filling with work that loses money. See our guide to HVAC gross margin.
- Revenue per technician.
Field labor is a large cost line, typically 30 to 40% of HVAC revenue, which is why utilization moves profit more than almost any other number. Our broader list of HVAC KPIs owners should track shows how these fit together. When you want to see how capacity decisions show up in job profitability and marketing returns, a predictable growth process for HVAC shows how lead flow and tracking connect to the schedule.
When the numbers say hire, and when they say fix the system
A long backlog does not automatically mean you need more technicians. A healthy backlog shows demand. A schedule that is overloaded in every season, with callbacks and late arrivals, points to a labor shortage. But before you add a crew, check three things:
- Demand: Are you overbooked because you sell too cheaply or promise dates you cannot meet?
- Operations: Are dispatch, call handling, parts readiness and job handoffs wasting hours? A crew that loses an hour a day to missing materials is a crew that is 12% smaller than it looks.
- Labor: Only then add people, and count them as productive only once they can run work alone.
Headcount is hard to reverse in the short term, so revenue per technician is the number that tells you whether a new hire adds profit or dilutes margin. Trade press makes the same point for larger mechanical firms: compare manpower requirements with commitments, realistic productivity and cash flow before accepting work. Hiring has its own lead time, so keep technician recruiting running before the peak, not during it.
Seasonality matters here. Plan capacity by season: the peak summer and winter weeks need a different mix of service reserve and install slots than the shoulder months. Our 8-week shoulder season plan covers how to use the slow weeks for training, maintenance sales and process fixes, so the crews are sharper when volume returns.
Where capacity plans break
The formula is simple. The failures are in the inputs and in who is accountable for them.
- Averages that hide the spread. One install average covers swaps and full systems alike.
- Capacity that lives in the owner’s head. If the number is not written down and reviewed weekly, sales sells against a feeling.
- Dispatchers who cannot say no. Without a rule for when to push a job, every call gets a slot and the schedule fails by Wednesday. This is where dispatcher training and clear call scripts pay off.
- No link between sales and the schedule. Salespeople promise start dates. Someone has to give them the real ones.
- No field owner. A field supervisor who reports actual hours back turns the plan into something you can improve.
Our perspective
Most owners we talk to treat capacity as a hiring question. We treat it as a systems question first. The shops that struggle usually do not have too few technicians. They have no measured job times, no written weekly capacity number, and nobody whose job is to say “we are full, here is the next date.”
We focus on trades only, and we work in the field with the team rather than handing over a template. That means looking at how calls are taken, how jobs are dispatched, how installs are handed off, and what the financial reports actually say about margin by job type. Capacity planning sits at the junction of all of those.
Our view: get the numbers visible, give your leaders ownership of them, and let the weekly rhythm do the work. The plan matters less than the habit of checking it.
Dan
Put the plan into practice with us
If you would rather not build this alone on top of a full schedule, Rebuilding the Trades works hands-on with HVAC, plumbing, electrical, roofing, remodeling and siding companies. Our offers include call management and dispatch training, install and project management training, management and leadership training, and financial operations assistance, all of which feed a reliable capacity number.

See how the Rebuild program and the training offers work, or read how a tri-trade company changed its operations.
FAQ
What is HVAC capacity planning?
It is the process of working out how many installs, service calls and maintenance visits your crews can complete in a given period, based on productive hours and measured job times. You then sell and schedule to that number. It is separate from sizing equipment for a building.
How do I calculate how many installs my crews can handle?
Multiply technicians by paid hours and working days, apply a realistic utilization rate, and divide the result by the person-hours each install takes. Round down and keep a 10 to 15% buffer. A two-person crew on a 10-hour job uses 20 person-hours.
What utilization rate should I use?
A starting assumption in the 70 to 85% range is common, but your own timestamps should replace it quickly. Utilization above about 90% leaves little room for slippage, so a plan built on it tends to run late.
How do I know when to add technicians?
Watch backlog days by season, callbacks, missed emergency calls and revenue per technician. If the schedule stays overloaded after you have checked pricing, dispatch and job handoffs, adding labor is the next step. Recruit ahead of peak season, because new hires take time to become productive.
Sources
- How to Read Manual J Reports
- How long air conditioning installation takes
- When HVAC contractors add techs and install crews
- Your HVAC company is growing, so why is your bank account empty
- Growing without breaking the business: how mechanical contractors can scale responsibly
- HVAC technician qualifications: your 2026 career guide
- HVAC predictable growth process
0 Comments