
Good contractor financial reporting comes down to four reports read on a fixed rhythm: a profit and loss (P&L), a balance sheet, a cash forecast and, if you bill on progress, a work-in-progress (WIP) schedule. Add a P&L split by department and a short weekly dashboard, and you can see which work makes money, where cash is going and what you will owe the bank or surety. This guide shows what each report tells you, how to set it up for an HVAC, plumbing or electrical company, and which numbers deserve your attention.
TL;DR
- Four reports carry the load: P&L, balance sheet, cash forecast and WIP. They are four views of one business, so they should tie together.
- A blended P&L hides weak lines. Require a department on every transaction so you can see margin by service, install and commercial work.
- Review a handful of metrics weekly and the full statements monthly. Weekly numbers drive action, monthly statements are the record.
- Most distortion comes from billing-based revenue, stale cost-to-complete estimates and overhead dumped into one bucket.
- Banks, sureties and buyers read these reports too, so consistency matters as much as accuracy.
Table of Contents
- The four reports every contractor should read
- How the reports connect
- Build a P&L by department
- The metrics worth tracking
- How often to review what
- Perspective: reporting fails at the shop, not the spreadsheet
- Common reporting errors that distort the numbers
- What lenders and sureties look for
- Getting started in 30 days
- Where we can help
- FAQ
- Sources
The four reports every contractor should read
Owners often look only at the bank balance and a year-end tax package. That tells you where you were, not where you are headed. Levelset’s overview names four core reports for construction companies, and they answer four different questions.
| Report | Question it answers | What it shows |
|---|---|---|
| Income statement (P&L) | Did we make money this period? | Revenue, direct costs, overhead, profit or loss over a set period |
| Balance sheet | What do we own and owe today? | Assets, liabilities, equity and working capital at one date |
| Cash-flow report or forecast | Will we have cash when bills come due? | Cash movement from operating, investing and financing activities, or expected cash in against cash out |
| WIP schedule | How are open jobs really performing? | Project progress, earned revenue, billings, and over- or underbilling |
The P&L
The ENERGY STAR contractor accounting guide describes the income and expense statement as a report of what you sold, what you spent on cost of sales and overhead, and what remained as profit over a specified period. The structure that matters is the split: direct job costs (labor, materials, subcontractors) sit above gross profit, and overhead sits below it. FinTruction makes the same point: separate direct job costs from overhead, or you cannot tell whether a thin result is a pricing problem or a spending problem.
The balance sheet
The balance sheet is a snapshot. It is where you see working capital, debt and equity. Contractors have two items that generic templates miss. FinTruction says a construction balance sheet should show retainage receivable and payable separately, along with WIP overbillings and underbillings. Lumping them into “accounts receivable” makes your liquidity look better or worse than it is.
The cash forecast
Profit is not cash. A company can post a good month and still miss payroll because customers pay late or materials were bought up front. The same FinTruction piece recommends forecasting collections and payments across a 13-week horizon. For a residential service company with fast payment, the forecast is simpler, but the habit of mapping expected cash in against cash out week by week still applies.
The WIP schedule
If you run installs, remodels or commercial projects billed on progress, the WIP schedule is the report that catches trouble early. Intuit’s construction accounting guide lists the core fields: contract value, approved changes, incurred costs, estimated cost to complete, recognized revenue, billings and billing status. Compare earned revenue to what you have billed:
- Overbilled: you have billed more than you have earned. It feels like cash in hand, but you owe the work.
- Underbilled: you have earned more than you have billed. Your profit looks good while your cash is tied up.
Under ASC 606, overbillings are reported as contract liabilities and underbillings as contract assets, which is how auditors and sureties will read them.
“Four types of financial reporting” and where WIP fits
Formal accounting usually lists the balance sheet, statement of income, statement of retained earnings and statement of cash flows as the basic statements. Associated Builders and Contractors material treats the WIP schedule as supplementary information that ties into the general ledger. Supplementary does not mean optional. For a contractor with open jobs, it is often the most revealing page in the package.
How the reports connect
The reports are not separate exercises. WIP feeds the P&L through revenue recognized on open jobs and feeds the balance sheet through over- and underbillings. The balance sheet feeds the cash forecast through receivables, payables and debt payments. When one report moves, the others should move with it.
That is why reconciliation matters. Intuit says reconciling job-level WIP schedules with company financial statements monthly helps protect bonding capacity, and that discrepancies can be a red flag to underwriters. If your WIP says one thing and your general ledger says another, you have a bookkeeping problem before you have a banking problem.
Build a P&L by department
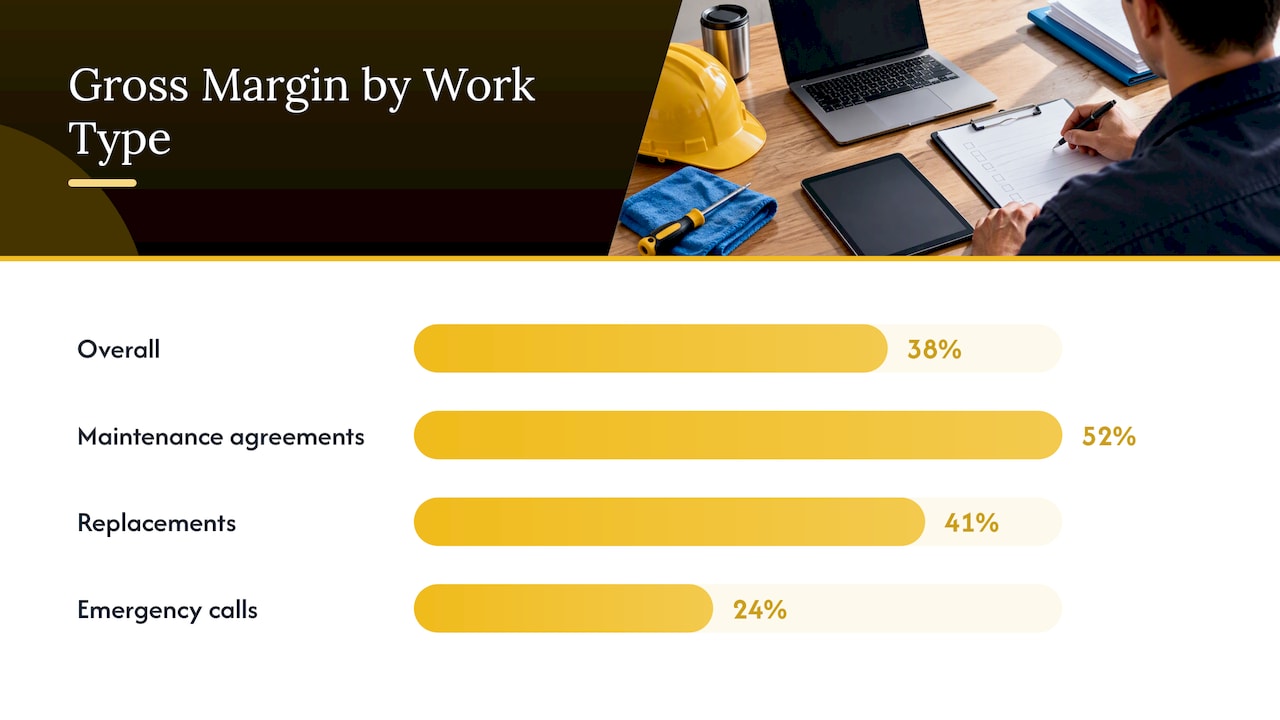
A single company-wide P&L is the most common way trade owners fool themselves. Install work might earn a healthy margin while service calls lose money, or the reverse, and the blended number looks fine. PMM Magazine warns that a blended monthly P&L can conceal materially different margins by job type, and suggests breaking out maintenance, standard service, emergency calls and installations or replacements.
A structure that works for HVAC, plumbing and electrical
Contractor Magazine’s article on reporting structure gives a clear model. Create divisions for HVAC, plumbing and electrical, separate residential from commercial, and create departments within each division. Its example departments include demand service, replacement and add-on, indoor air quality and accessories, new construction, design and specification, and remodel.
The rule that makes it work: require a department on every financial transaction. Every invoice, bill, payroll entry and credit card charge gets one. Do that and your accounting system can produce an income statement for each department down to net profit.
The same article calls this a “thick” general ledger, one that carries detail such as departments, labor minutes, warranty, callbacks, service agreements and product categories. Build that detail into your chart of accounts once, and every report afterward gets sharper.
Allocating shared costs without fooling yourself
Rent, office staff, trucks, insurance and software serve every department. You have two honest choices, and you must pick one and keep it:
- Direct allocation: charge costs to the department that causes them. A truck belongs to the department whose technician drives it. A dispatcher’s time can be split by call volume.
- Pooled overhead with a stated driver: keep shared overhead in one pool and allocate it by a driver you can defend, such as revenue share, labor hours or headcount.
Whichever you choose, write it down and apply it every month. Changing the allocation method halfway through the year makes department trends meaningless. Also keep direct costs and overhead visibly separate, so a department showing a good gross margin cannot hide behind an arbitrary overhead number.
A quick example of what department reporting reveals
Say a company shows a 38% gross margin overall. Split by department, the picture might be 52% on maintenance agreements, 41% on replacements, and 24% on emergency calls after overtime and callbacks. These figures are illustrative, not benchmarks. The point is that the blended number would have told you nothing about the emergency line, and it would have hidden that your best margin comes from the work your sales team talks about least.
The metrics worth tracking
Financial statements are lagging. Metrics are how you steer between them. Plumbing & Mechanical cautions that revenue, profit and cash are different measures, and names fully burdened labor, gross margin by work type and callback or rework costs as common sources of misinterpretation.
Profitability metrics
- Job profit: revenue minus labor, materials, subcontractor costs and allocated overhead, as PMM Magazine defines it.
- Gross margin by job type: gross profit divided by revenue, tracked separately for service, replacement, maintenance and new construction.
- Margin per technician-hour: gross profit divided by technician hours. It shows which work earns the most from your scarcest resource, labor.
- Callback and rework cost: the cost of returning to a job you already billed. It rarely shows up as its own line unless you set one up.
Use fully burdened labor in all of these: wages plus payroll taxes, benefits, workers’ comp and truck and tool costs where you can assign them. Raw hourly pay makes every job look more profitable than it was.
Cash metrics
- Weekly change in cash
- Collectible receivables and aged receivables
- Retainage outstanding
- 90-day cash runway, which Plumbing & Mechanical includes in its weekly dashboard
Job performance metrics
FinTruction describes job-cost detail as tracing transactions by cost code, and budget-versus-actual as comparing estimated costs with actual or committed costs. Job profitability then compares revenue, cost and gross margin by project. For installs, the most useful line is estimated versus actual labor hours. If you want to improve the estimate side, our guide to labor forecasting for contractors walks through it.
Operational efficiency metrics
The Plumbing & Mechanical dashboard also covers calls and answer rate, booked rate, close rate, estimate aging, billable hours or utilization, average ticket and material percentage. These tie operations to the financial result. A drop in booked rate shows up in revenue weeks later. Slow estimate follow-up shows up in aged quotes long before it shows up in the P&L.
How often to review what
Not every report needs the same cadence. Here is a practical rhythm drawn from the sources above.
| Cadence | What to review | Why |
|---|---|---|
| Weekly | Cash, collectible receivables, backlog, revenue per truck, completed-job gross margin, aged quotes, technician utilization, overhead versus budget | Level’s weekly dashboard of numbers owners check to catch problems while they can still be fixed |
| Weekly on active jobs | Budget versus actual | Overruns are cheapest to catch early |
| Monthly | P&L, balance sheet, WIP, job profitability, backlog | The statements that show the true picture |
| Quarterly or annually | Formal statement packages | What banks and sureties request |
Level suggests reviewing its dashboard metrics on Mondays and doing monthly deep dives within 15 business days of month-end close. If you bill progress on commercial work, include WIP in the monthly review and tie it to the general ledger and contract records. FinTruction adds that WIP should be reviewed monthly at minimum and more often on fast-moving projects.
Plumbing & Mechanical frames the dashboard as a cockpit. Weekly leading indicators drive action, and monthly statements provide the background record. That split is the right mental model: do not wait for the month-end package to find out you have a problem.
Watch trends, not single months. PMM Magazine says three months shows a pattern and six months tells a business story. A single bad month can be weather or one big job.
Perspective: reporting fails at the shop, not the spreadsheet
We work only with trade businesses, and the pattern we see is rarely a missing report. It is a report nobody trusts, or one that nobody acts on. The financials arrive late, categories are inconsistent, the numbers do not match what the owner feels in the field, and so decisions go back to instinct.
Our view is that financial visibility is an operations problem first. If dispatchers do not code calls consistently, if technicians do not record time, if install managers do not update cost-to-complete, the best accountant in the country cannot produce a useful P&L by department. Clean reporting depends on field habits and on leaders who hold people to them.
So we start with the few numbers an owner will actually use each week, assign each one an owner on the team, and build accountability around it. Then we layer on the department detail. Owners who see margin by department tend to make faster, calmer decisions about pricing, hiring and which work to chase.
— Dan
Common reporting errors that distort the numbers
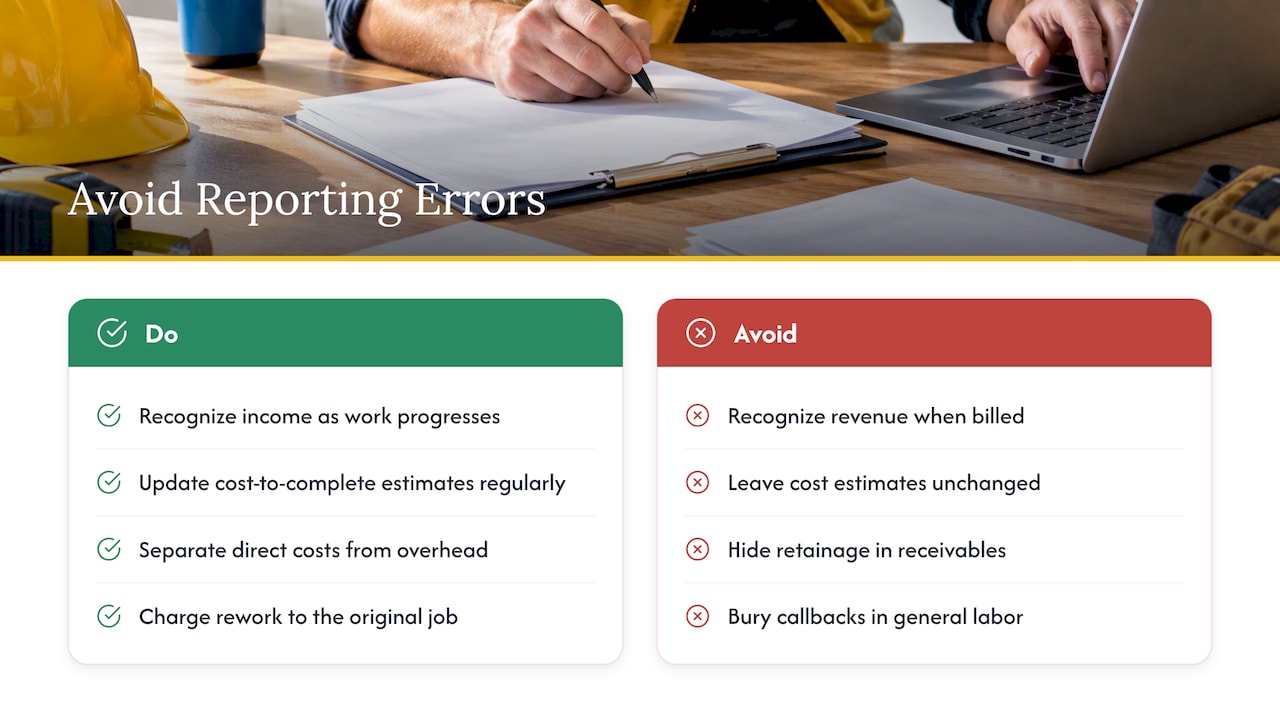
Recognizing revenue when you bill. Percentage-of-completion recognizes income as work progresses, not from amounts billed or collected. FinTruction warns that billing-based recognition can materially misstate profit. Note that percentage-of-completion is also an income tax method for some contractors, covered by size and contract rules, so ask your CPA which method applies to you.
Stale cost-to-complete estimates. Contractor Magazine says cost-to-complete estimates need regular comparison with budgeted or estimated costs and should reflect all costs tied to performing the contract. If the estimate was set at the start and never updated, the schedule shows a healthy job right up until it does not. This is margin fade, and a current estimate is how you see it coming.
One bucket for overhead. Without direct costs separated from overhead and a consistent allocation method, department results are opinions.
Mixing retainage and receivables. Hiding retainage inside receivables overstates what you can collect soon.
Ignoring callbacks. If rework hours are charged back to the original job or a callback department, you see the true cost of a rushed install. If they vanish into general labor, you do not.
WIP that does not tie out. Mismatches between WIP and the ledger erode trust with lenders and sureties.
What lenders and sureties look for
If you pursue bonded work or a credit line, the reports above become an external requirement. Lenders and sureties generally want to see consistent statements, current WIP schedules and cost-to-complete estimates that hold up from month to month. Many also ask for reviewed or audited statements as the company grows, so ask your CPA and your surety what level they expect before you need it. Starting a monthly reconciliation habit early makes that conversation much easier.
Getting started in 30 days
- Week 1: List your divisions and departments. Add a required department field to every transaction in your accounting system.
- Week 2: Separate direct job costs from overhead on your P&L. Decide on your allocation method and write it down.
- Week 3: Set up a one-page weekly dashboard with five to seven numbers and a named owner for each.
- Week 4: If you bill on progress, build or clean up your WIP schedule and reconcile it to the ledger. Set the monthly review date.
Expect the first month of department data to be messy. The second is useful, and by the third you will see patterns.
Where we can help
If your numbers arrive late, do not match the field, or leave you guessing which department earns its keep, that is the work we do inside trade businesses. Our Rebuild program includes financial operations and compliance assistance alongside leadership, sales, dispatch and project management training, so reporting and the people who feed it improve together.
FAQ
What financial statements does a contractor need?
At minimum, a P&L, a balance sheet and a cash forecast. If you bill on progress, add a WIP schedule. Banks and sureties usually ask for the basic statements plus WIP as supporting information.
How do I create a P&L by department?
Set up divisions and departments in your chart of accounts, then require a department on every transaction. Keep direct costs separate from overhead, and allocate shared costs using one consistent method. Your accounting system can then report each department down to net profit.
How often should I review contractor financial reports?
Review a short dashboard weekly and the full statements monthly. Review budget versus actual on active jobs weekly, and include WIP monthly if you do progress billing. Formal statement packages for lenders are typically quarterly or annual.
What is the difference between revenue, profit and cash?
Revenue is what you earned, profit is what remains after costs, and cash is what is actually in the bank. They move at different speeds. A profitable month can still leave you short if customers pay late or you front materials, which is why you need all three views.
Sources
- 4 Financial Statements For Contractors (Levelset)
- Accounting Basics for Contractors (ENERGY STAR)
- 4 Reports, Not 1: P&L, Balance Sheet, Cash, WIP
- What Financial Reports Does a Contractor Actually Need? (FinTruction)
- Construction project accounting (Intuit)
- WIP Schedules: How Auditors and Sureties Read Them
- Basics of Construction Accounting Financial Management (ABC)
- Financial Reporting Structure for a Contracting Business (Contractor Magazine)
- Feature 05 Profitability (PMM Magazine)
- Beyond Revenue: The KPIs That Drive Plumbing Profitability
- The Contractor Financial Dashboard (Level)
0 Comments