
The fully burdened labor rate is the true hourly cost of an employee once you stack payroll taxes, benefits, workers’ comp, paid leave, and overhead on top of base wages, then divide by the hours that employee actually produces billable work. Use this number, not the wage on the paycheck, as your floor for every estimate, maintenance agreement, and internal budget. The BLS tracks the national scale of this gap, and pricing systems around this figure for HVAC, plumbing, and electrical clients are built by specialized consultants.
TL;DR:
- To accurately estimate job costs, contractors must include all burdened expenses like payroll taxes, workers’ comp, benefits, overhead, and productive hours, not just wages.
- State-specific workers’ comp and unemployment rates can significantly impact the true labor cost, especially in high-premium regions or trades with higher risks.
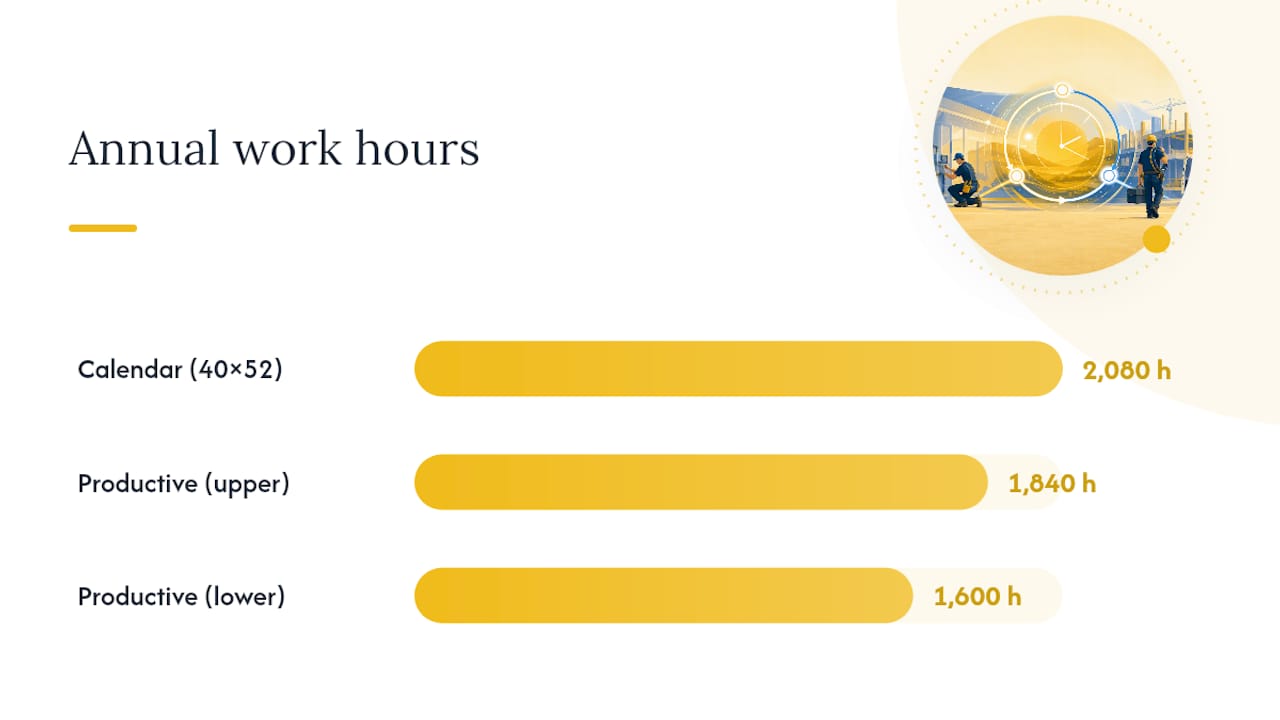
- Realistic productive hours usually range between 1,600 and 1,840 annually, and using incorrect hours skews the burdened rate, risking under- or over-pricing jobs.
- Industry burden percentages vary, with trades often exceeding 28 percent due to higher workers’ comp and equipment costs, unlike office work typically below 25 percent.
- Regularly revisiting and applying department-specific burdened rates in pricing and forecasting is crucial to maintaining profit margins and preventing margin erosion.
Table of Contents
- What Goes Into a Fully Burdened Labor Rate
- How to Calculate Your Fully Burdened Labor Rate
- How Burden Rates Compare Across Industries
- Ways to Manage Your Fully Burdened Cost
- Mistakes That Throw Off Your Numbers
- Putting the Rate to Work in Your Price Book
- Three Steps to Take This Week
- The Real Problem Isn’t the Math
- Sources
What Goes Into a Fully Burdened Labor Rate
Base pay is just the entry point. A real fully burdened rate stacks several cost buckets on top of it, and skipping any one of them is how contractors end up pricing jobs at a loss without noticing until cash gets tight.
- Base pay: hourly or annualized wage before any additions
- Employer payroll taxes: Social Security and Medicare (FICA), federal unemployment (FUTA), and state unemployment insurance (SUI)
- Workers’ compensation: premiums that vary heavily by trade classification and state
- Benefits: health insurance, retirement matching, life and disability coverage
- Paid leave: vacation, sick time, holidays, the hours you pay for but don’t get production from
- Recruiting and onboarding: advertising, background checks, training time, ramp-up inefficiency
- Equipment and software: tools, vehicles, licenses, and field apps assigned to that role
- Allocated overhead: a slice of rent, insurance, admin salaries, and utilities spread across labor hours
Workers’ comp and SUI rates swing widely by state and by trade classification, so a national-average calculator can quietly understate your real cost if you’re a roofer in a high-premium state. That’s a practitioner-level warning worth taking seriously before you trust any generic benchmark tool.
The other decision that changes everything: how many “productive hours” you divide by. The calendar gives you 2,080 hours a year (40 hours times 52 weeks), but almost nobody actually produces billable work for all of them. Once you subtract PTO, holidays, training, and slow stretches, realistic productive hours usually land between 1,600 and 1,840 for field roles. Divide by the wrong number and your rate is wrong before you’ve even added a single cost.
How to Calculate Your Fully Burdened Labor Rate
The formula has two steps, and both are simple once you have the right inputs in front of you.
Annual total cost = Base wages + Payroll taxes + Workers’ comp + Benefits + Paid leave + Recruiting/onboarding (amortized) + Allocated overhead
Fully burdened hourly rate = Annual total cost ÷ Productive hours
Here’s where to pull each number from:
- Base wages — your payroll register or offer letter
- Payroll taxes — your payroll provider’s tax summary (FICA, FUTA, SUI)
- Workers’ comp — your policy’s rate table, since it’s classified by job duty
- Benefits — health, dental, and retirement invoices from your broker or plan administrator
- Paid leave — your PTO policy converted to a dollar value at the base wage
- Recruiting/onboarding — actual spend on hiring and training, spread across the employee’s first year
- Overhead — total shop overhead divided across total labor hours company wide
Now the worked example. Say you employ a field technician at a $60,000 base salary.
The benefits math checks out against national data. The BLS reports employer costs for compensation averaged $49.32 per hour in March 2026, with wages at $33.72 and benefits at $15.60, meaning benefits alone made up almost 32% of total compensation cost nationally. If your benefits allocation comes in far below that share, double check what you’re leaving out.
One sensitivity note worth flagging: shift productive hours from 1,720 to 1,600, and that same $89,520 becomes $55.95 per hour. A 120-hour swing moved your rate almost $4. Get the productive-hours assumption wrong and every bid built on it is wrong too.
How Burden Rates Compare Across Industries
Burden percentages (the markup over base wage) cluster differently depending on the kind of work and how physically demanding or regulated it is.
- Office and knowledge work: roughly 18–25% above base wage, driven mostly by benefits and light overhead
- Manufacturing and retail: roughly 22–28%, with workers’ comp starting to matter more
- Construction and trades: 28% to 40% or higher, where workers’ comp and equipment costs pile on fast
Homebase’s guidance puts the real cost of many small-business employees at 20–30% above base wage, though it notes restaurants often run 30–37% and retail closer to 15–30%. Trade work tends to sit at the higher end of any of these ranges because of physical-risk premiums.
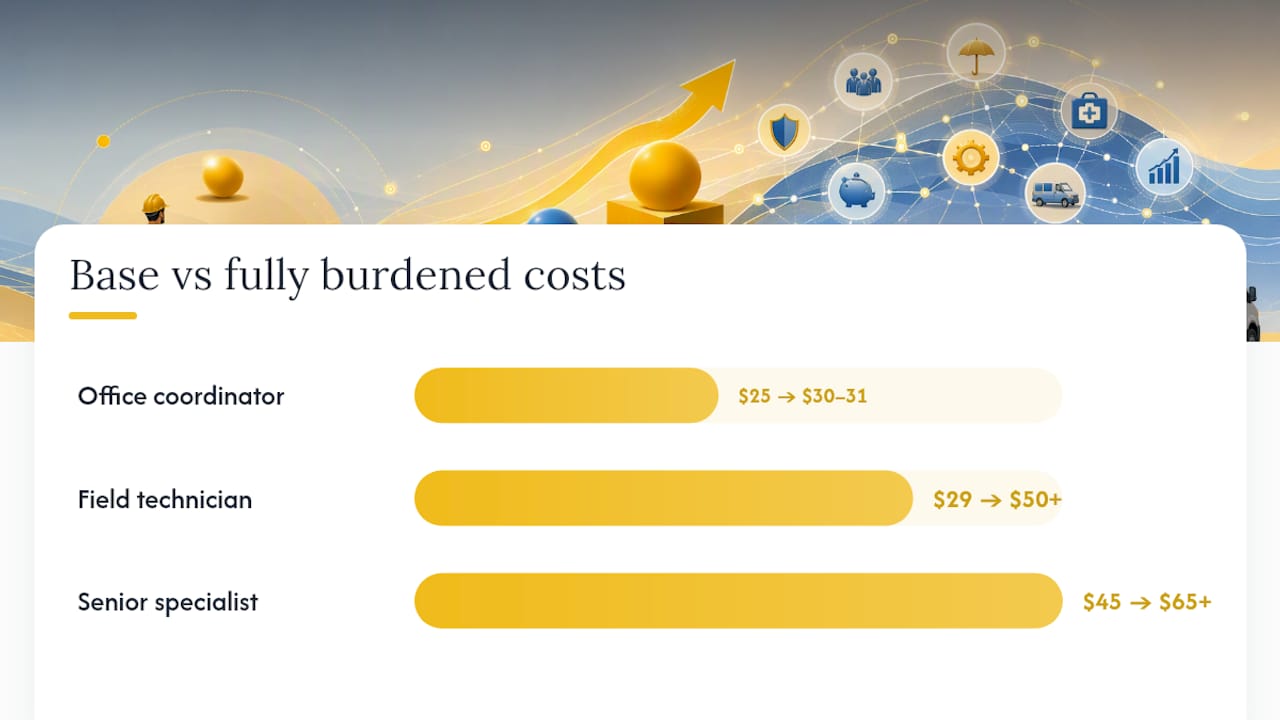
A quick gut check: an office coordinator at $25/hour might burden to around $30 to $31. A field technician at $29/hour, given higher workers’ comp and equipment costs, often burdens to $50 or more. A senior specialist commanding $45/hour with richer benefits and higher training investment can burden past $65. Geography, benefit richness, union agreements, and even age-related benefit costs all push these numbers around, which is exactly why a single company-wide average rarely fits every role.
Ways to Manage Your Fully Burdened Cost
You can’t eliminate burden, but you can control how much of it you’re carrying and where.
- Redesign benefits tiers so richer coverage goes to roles where retention matters most, not blanket enrollment
- Renegotiate workers’ comp by reviewing job classifications, since misclassified roles often overpay
- Improve utilization and scheduling to close the gap between paid hours and billable hours
- Cap unplanned overtime, which inflates cost without proportionally increasing output
- Allocate overhead by actual usage instead of an even split across every employee
Subcontracting shifts some burden off your books entirely, trading a fixed cost for a variable one, which can make sense for spiky demand or specialty work you don’t do often enough to staff full time.
Pro Tip: Calculate burdened rates by role or department instead of one company-wide number. A field crew and your office admin carry wildly different overhead and workers’ comp loads, and blending them into one average quietly overcharges simple jobs while undercharging complex ones.
Mistakes That Throw Off Your Numbers
The math is straightforward. The mistakes almost always come from bad inputs, not bad formulas.
- Using 2,080 hours without adjusting for PTO and holidays inflates your denominator and understates your true rate
- Ignoring state-level SUI and workers’ comp differences when applying a “typical” national benchmark
- Forgetting recruiting and onboarding costs, which are real dollars even though they don’t show up on a pay stub
- Double-counting overhead by allocating the same rent or insurance line into two different cost buckets
Reconcile your math at least once by comparing your total payroll ledger against the sum of your individual burden inputs. If the two don’t match within a small margin, one of your allocations is wrong somewhere. Rerun the full calculation annually, and immediately after any major change to benefits, insurance premiums, or payroll tax rates.
Putting the Rate to Work in Your Price Book
Once you have a real number, it belongs in every estimate, not in a spreadsheet nobody opens again. Set your fully burdened hourly rate as the pricing floor for service calls, project labor, and maintenance agreements, then build margin on top of it rather than on top of raw wages.
- Embed department-specific rates into your price book so HVAC install crews and service techs aren’t priced off the same blended number
- Use the rate to forecast job profitability before you bid, not after the invoice goes out
- Feed it into recurring-revenue pricing, the same discipline behind Rebuildingthetrades’ three-tier maintenance agreement approach that helped one client scale toward a $21 million run rate
- Track utilization alongside the rate using the kind of KPI framework HVAC owners rely on for profit visibility
- Revisit rates whenever you approve a change order, since scope creep often hides labor you never priced
Contractors who skip this step tend to notice margin erosion only at year end, long after the underpriced jobs are already closed out.
Three Steps to Take This Week
Pull your real payroll, benefits, and workers’ comp numbers and calculate your fully burdened rate today, not next quarter. Apply department-level rates as hard pricing floors on every quote. Put a recurring review on the calendar, at minimum annually, and immediately after any payroll or benefits change.
The Real Problem Isn’t the Math
Most contractors who get burned by labor costs didn’t do the arithmetic wrong. They used a rate that was accurate six months ago and never revisited it after a workers’ comp renewal or a new health plan kicked in. The formula here is genuinely simple, five inputs and a division sign, but treating it as a one-time exercise instead of a recurring discipline is where the real damage happens.
The conventional advice, “know your labor cost,” undersells the actual lever. Knowing the number matters less than where you apply it. A fully burdened rate sitting in a spreadsheet does nothing. The same rate embedded as a floor in your price book, split by role instead of blended into one company average, is what actually protects margin as you scale. That’s the gap between businesses that grow profitably and ones that grow their way into a cash crunch: not sophistication, just discipline about updating and applying a number they already know how to calculate.
If you fix one thing this year, fix the update cadence, not the formula.
— Dan
This article is general information, not a substitute for advice from a qualified financial advisor. Consult a qualified financial professional about your own circumstances before acting on anything here.
Sources
- Employer Costs for Employee Compensation — BLS
- How to Calculate Labor Cost: A Complete Guide | Homebase
0 Comments