
The 8 to 10 field service KPIs worth tracking now are first-time fix rate, technician utilization, jobs per tech per day, revenue per crew per day, job-level gross profit, average ticket value, average response time, failed visits and repeat visits, days sales outstanding and customer retention. Each one below comes with a formula, a benchmark range, and a measurement rule so you can start tracking it this week, not next quarter.
TL;DR:
- Improving first-time fix rate requires confirming parts and diagnosis before dispatch to reduce repeat visits and failed jobs.
- Tracking technician utilization involves auditing drive times and scheduling buffers to identify routing issues rather than technician laziness.
- Shortening days sales outstanding depends on invoicing at job completion and adopting text-to-pay methods to accelerate cash flow.
- Benchmark targets should be set slightly above peer performance after establishing a baseline and revisited quarterly, especially for slow-moving metrics like gross profit and retention.
- Prioritizing five key KPIs—cash flow, failed visits, technician utilization, first-time fix rate, and customer retention—maximizes profit impact and simplifies review processes.
Table of Contents
- 1. The core KPIs, their formulas, and what good looks like
- 2. How to make these KPIs trustworthy before you act on them
- 3. Turning benchmarks into weekly and monthly targets
- 4. A practical checklist from hands-on trade consulting
- 5. The KPI traps that quietly sink good intentions
- 6. How Rebuilding the Trades helps owners build KPI systems that hold
- Sources
- FAQ
1. The core KPIs, their formulas, and what good looks like
These ten metrics cover the operational and financial health of a field service business. Track them consistently and you can see problems before they hit the bank account.
- First-time fix rate (FTF): jobs resolved on the first visit divided by total jobs, sourced from your field service management (FSM) or dispatch system. NetSuite lists FTF among the core field service KPIs tied to service efficiency. Improve it by requiring techs to confirm parts and diagnosis before dispatch, not after arrival.
- Average response time: time from ticket creation to technician arrival, pulled from dispatch logs. Define the start point explicitly (ticket creation, not dispatcher assignment) so comparisons stay valid. Cut it by clustering jobs geographically instead of dispatching in call order.
- Technician utilization (jobs per tech per day): billable hours divided by total scheduled hours, or completed jobs divided by available tech days, from your scheduling software. A tech running fewer jobs than peers usually signals routing problems, not laziness. Fix it by auditing drive time and buffer windows in the schedule.
- Revenue per crew per day: total invoiced revenue divided by crew days worked, from accounting or invoicing data. This flags underpriced jobs and slow crews in the same number. Raise it by pairing your best closer with your slowest crew for a month.
- Job-level gross profit: job revenue minus direct job costs (labor, materials, subcontractors), tracked per work order in accounting. Most owners know overall margin but not which job types bleed money. Break profit out by job type quarterly and drop the ones that lose money.
- Average ticket value: total revenue divided by total completed jobs, from invoicing data. Grow it by training technicians to present options instead of a single fix, a practice covered in service manager training programs.
- Failed visits and repeat visits: visits that do not resolve the issue divided by total visits, tracked in FSM ticket status. Pair this with mean time to resolution (MTTR), the average time from first ticket to final close. Reduce failed visits with better upfront triage and parts verification.
- Days sales outstanding (DSO): accounts receivable divided by average daily sales, multiplied by the period in days, from your accounting system. High DSO quietly starves cash flow even when revenue looks strong. Shorten it with text-to-pay and invoicing at job completion, not weekly batches.
- Customer retention and CSAT/NPS: repeat customers divided by total customers over a set period, plus survey scores from CRM or post-job text surveys. A dip here usually shows up in revenue two quarters later. Tie technician bonuses partly to CSAT so service quality stays visible.
- Technician productivity: completed job value divided by labor hours paid, blending utilization and ticket value into one number. Use it to compare crews fairly even when job mix differs.
2. How to make these KPIs trustworthy before you act on them
A number without a clear definition invites arguments, not decisions. ASQ’s DMAIC framework gives you a closed loop for that: define the problem and the metric, measure it consistently, analyze root causes, improve the process, then control it so the gain holds. Skipping straight to “improve” is how dashboards fill up with metrics nobody trusts.
Before you trust a KPI, map it with SIPOC+CM: suppliers, inputs, process, outputs, customers, constraints, and measures. This forces you to name who feeds the data, what the process actually does, and what constraints (parts availability, staffing) affect the result. ASQ’s guidance on performance metrics warns that indicators compress complex processes into single values, and without operational definitions and context, they mislead more than they help.
Use this checklist before you act on any KPI:
- Does the metric have a documented start and stop point (for example, when the response-time clock begins)?
- Are job inclusions and exceptions written down, not just understood by one person?
- Does the KPI have a named owner, a data source, and a review cadence?
- Is there a documented response for when the metric crosses a threshold?
Pro Tip: Write the operational definition of a KPI on one index card. If you can’t fit it there, the metric isn’t defined tightly enough to trust.
3. Turning benchmarks into weekly and monthly targets
Start with your own baseline, then compare it against peer benchmarks, then set an aspirational target slightly ahead of the best performers you can realistically match. A baseline without a benchmark tells you where you stand but not how far you can go.
- Set weekly targets for fast-moving metrics like response time and jobs per tech, since delays compound daily.
- Set monthly targets for DSO, gross profit, and retention, since these move slower and need a full billing cycle to read clearly.
- Segment targets by trade and by residential versus commercial mix, since a plumbing crew and an HVAC install crew carry different cost structures.
- Revisit targets quarterly as crew size and service mix change.
Failed visits cost a substantial portion of total service cost in field service businesses, and the gap between top and bottom performers is stark: top performers have significantly fewer failed visits compared to bottom performers, according to the 2026 Field Service Benchmark Report. That gap alone shows why failed-visit reduction is often the single highest-leverage target an owner can set.
4. A practical checklist from hands-on trade consulting
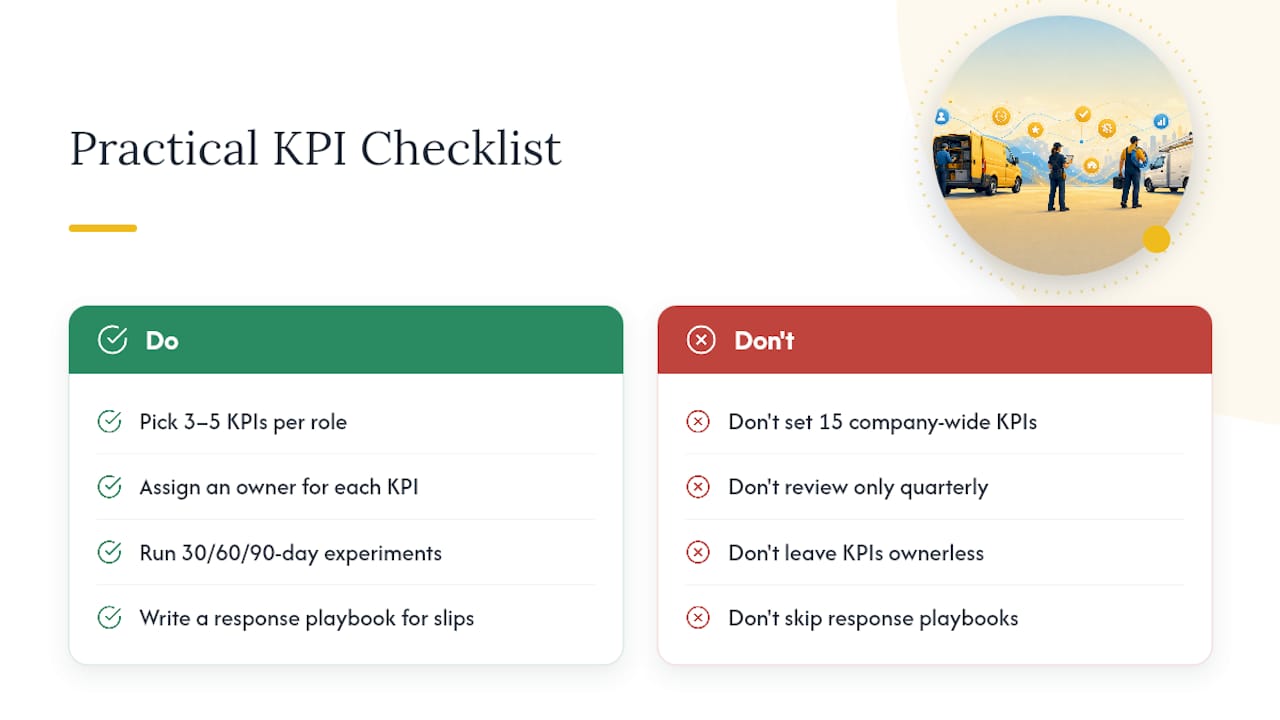
Pick 3 to 5 KPIs per role, not fifteen for the whole company. Give each one an owner, run a 30/60/90 day experiment, write a response playbook for when the number slips, and review it weekly, not quarterly. This is the same structure covered in our HVAC KPI guide for owners building their first scorecard.
Three quick wins show up fastest: tighten triage to cut failed visits, teach technicians an options sell to raise average ticket, and move to text-to-pay invoicing to shrink DSO. Trade businesses we’ve worked with have used structures like this to build the operational clarity behind results such as the $21 million run rate documented in our case study.
5. The KPI traps that quietly sink good intentions
Most owners fail not from missing KPIs but from tracking too many. A twenty-metric dashboard nobody reviews is worse than five metrics reviewed every Monday. Prioritize cash (DSO), failed visits, technician utilization, and first-time fix rate above everything else, since these four drive most of the profit swings I see in trade businesses.
Review cash and dispatch metrics daily, crew profitability weekly, and retention monthly. Where it fits, tie KPI targets to coaching conversations and compensation, not just a scoreboard on the wall.
— Dan
6. How Rebuilding the Trades helps owners build KPI systems that hold
Most owners already have data. What’s missing is a system that turns it into a habit: the right KPIs, a clear owner for each, and a cadence that survives a busy week. That’s the gap our engagements close.

A typical engagement starts with an onsite audit of current metrics and reporting, then narrows the list to the KPIs that matter for that specific trade and crew size. From there:
- Management and leadership training can build the habit of reviewing KPIs weekly with the team, not just the owner.
- Financial operations and compliance assistance can help improve the accounting data feeding DSO and gross profit numbers, including expert PAT testing to ensure service safety and compliance with Expert PAT Testing Services & Safety Compliance Services.
- Sales training may target average ticket value through improved in-home presentation techniques.
If you want help building a KPI system that actually gets used, start with our Rebuild service or reach out through our main site to talk through your current numbers.
Sources
- DMAIC | ASQ
- 2026 Field Service Benchmark Report
- A Comprehensive Guide to Field Service Metrics & Key Performance Indicators | NetSuite
FAQ
What are the 5 main KPIs for a field service business?
The five most commonly prioritized are first-time fix rate, technician utilization, revenue per crew per day, days sales outstanding, and failed visits. These cover service quality, labor efficiency, cash flow, and cost leaks in one small set, which is why role-specific KPI guidance recommends limiting each role to about five metrics.
What are the top 3 KPIs to start with?
Cash (measured through DSO), failed visits, and technician utilization give the fastest read on financial health and crew efficiency. These three surface problems that show up in revenue and profit within weeks if left unaddressed.
What are some good field service KPI examples?
Good examples include first-time fix rate, average response time, average ticket value, job-level gross profit, and customer retention. Each pairs an operational number with a clear formula and a defined data source, whether that’s your FSM system, dispatch log, or accounting software.
What are the four main KPIs for field service teams?
A focused four-metric set usually includes first-time fix rate, technician utilization, days sales outstanding, and failed visits. Together they capture service quality, crew productivity, and cash flow without overloading a weekly review.
0 Comments