
A flash report for contractors is a one-page, weekly KPI snapshot showing cash, project cash flow, technician productivity, dispatch performance, and backlog so owners can make fast operational decisions. It runs on a weekly cadence, feeds directly into escalation decisions, and replaces the monthly financial statement as the tool owners actually look at first.
TL;DR:
- Cash on hand and current ratio should be monitored daily and kept near target levels of at least 1.5 for the ratio and sufficient cash for immediate needs.
- Project cash flow and job progress metrics must be updated daily to detect and address negative cash positions before they escalate.
- Weekly review should focus on red flags such as uncollected receivables over terms and projects below 25% completion with negative cash flow.
- The report layout should present four KPIs per section with trend lines, delta figures, and traffic light indicators for quick assessment.
- A dedicated owner should be responsible for data collection and weekly validation to ensure timely and accurate reporting.
Table of Contents
- What KPIs belong on a contractor’s flash report
- How to calculate each metric and what target to aim for
- Where the numbers come from and how often to refresh them
- Building the one-page layout readers will actually use
- Making the flash report part of the weekly routine
- How Rebuilding the Trades helps you build and run this system
- Where to verify these benchmarks and grab a template
- Sources
- FAQ
What KPIs belong on a contractor’s flash report
Most owners try to track too much and act on none of it. A flash report works because it forces a short list, and the list below is ordered by how fast each number should trigger a decision.
Financial KPIs come first because cash problems move faster than anything else in a trade business.
- Cash on hand: the bank balance today, checked daily.
- Working capital as a percentage of revenue, a health check on whether the business can fund its own growth.
- Current ratio, a quick read on short-term solvency.
- Days sales outstanding (DSO), the clearest early warning for collection trouble.
Project-level KPIs catch the jobs quietly bleeding cash before they blow up a quarter.
- Project cash flow position on every open job over a set size threshold.
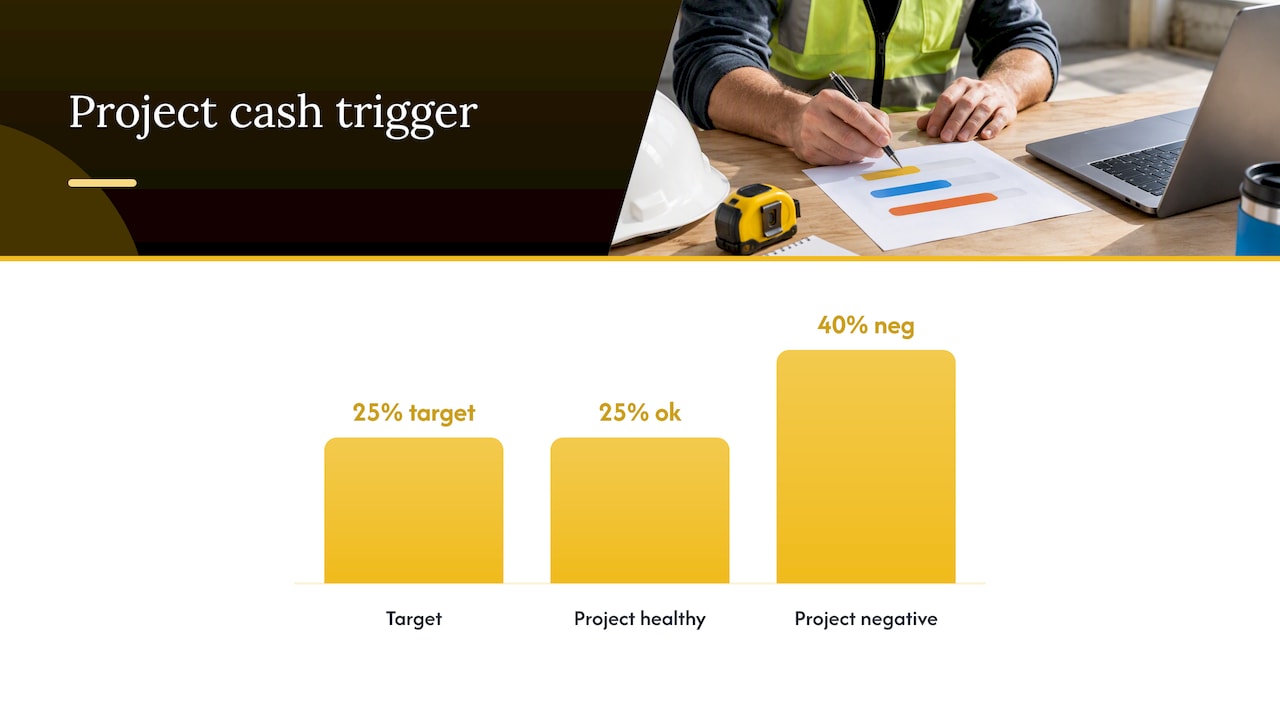
- Percent complete versus the cash-positive target, typically hit around the 25% mark.
- Budget variance, actual cost against estimated cost at current percent complete.
Operational KPIs measure whether field labor is producing what was sold.
- Labor productivity: hours earned against hours burned.
- Technician utilization: billable hours against hours available.
- Schedule variance: planned completion date against current forecast.
Dispatch and service KPIs matter most for HVAC and plumbing service operations running daily call volume.
- Average response time from call to technician arrival.
- SLA hit rate, the share of calls meeting the promised response window.
Sales and pipeline rounds out the page with forward visibility.
- Qualified backlog in dollars, and the 4-week intake trend against it.
CFMA’s guidance on monitoring construction businesses lists a similar core set at the project and company level: liquidity, backlog, labor productivity, schedule variance, budget variance, and project cash flow. A one-page report that tries to include everything an accountant might want ends up read by no one. Fifteen numbers, refreshed weekly, beat sixty numbers refreshed monthly.
How to calculate each metric and what target to aim for
A KPI without a target is just a number. Each metric below needs a formula and a benchmark before it’s useful on a flash report.
Cash and liquidity formulas:
- Working capital % of revenue = (current assets minus current liabilities) divided by trailing 12-month revenue.
- Current ratio = current assets divided by current liabilities.
- Quick ratio = (current assets minus inventory) divided by current liabilities.
- DSO = (accounts receivable divided by total credit sales) multiplied by the number of days in the period.
Target ranges commonly recommended for contractors, drawn from NFBA’s guidance on managing contractor cash flow:
- Working capital target typically recommended to be a moderate percentage of revenue.
- Current ratio often targeted near one and a half to one.
- Quick ratio commonly near one to one.
- Debt-to-equity ratio generally advised to remain at or below a moderate multiple.
- Projects expected to be cash positive by about one quarter complete.
Project cash position is the formula that turns unbilled work into something an owner can act on today: billings to date plus expected billings this week, minus cash collected to date, minus committed costs to date. NFBA’s cash flow guidance also recommends including DSO as a project manager metric and setting up formal escalation when a receivable ages past terms, including naming one person, sometimes called a bird dog, to own collection on a specific account.
Missing or lagging data is normal. Time entries often post a day or two late, and billed-but-uncollected amounts need to be flagged rather than treated as cash. CFMA recommends maintaining a work-in-progress cash proxy fed by project manager estimates when accounting postings lag, reconciled to the ledger on a set schedule so the proxy never drifts too far from reality.
The same job at 25% complete with a small positive balance is green, meaning normal monitoring continues with no action needed.
Where the numbers come from and how often to refresh them
A flash report is only as good as the systems feeding it, and most contractors already have the data scattered across four places.
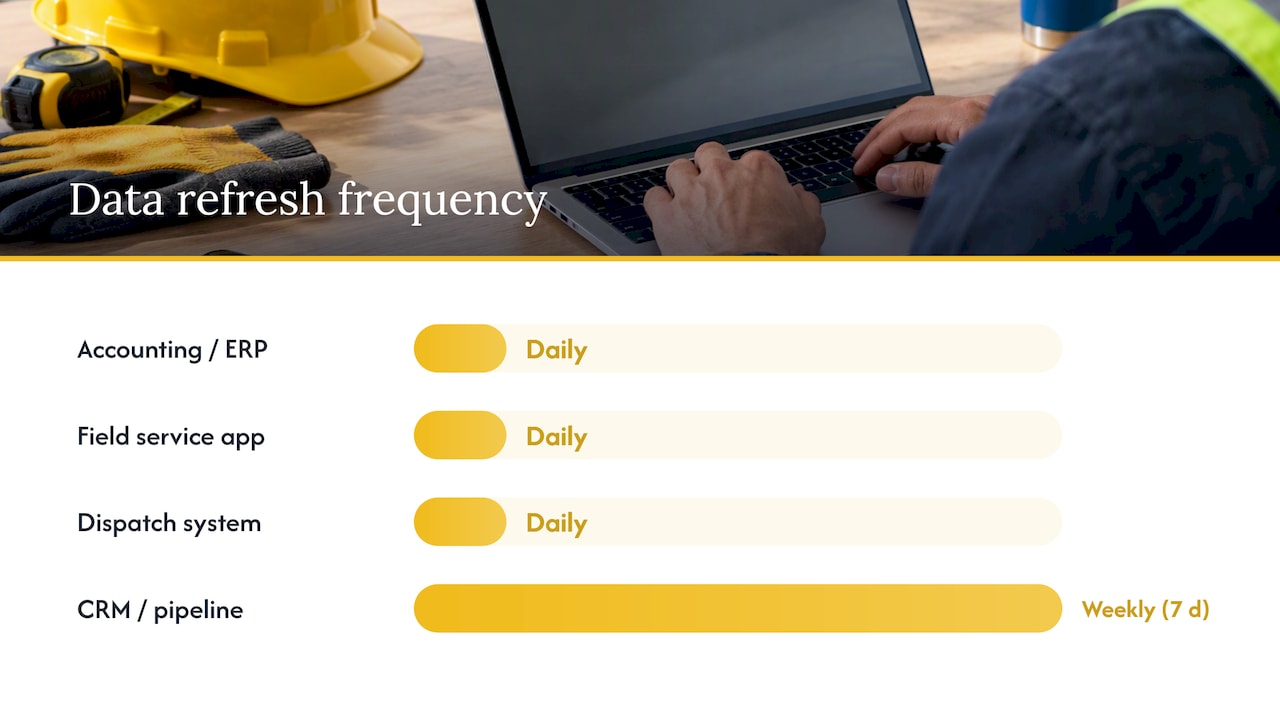
- Accounting or ERP system supplies cash on hand, AR aging, DSO, and the balance sheet ratios, pulled daily for cash and weekly for the rest.
- Field service app supplies hours burned, hours earned, and technician utilization, ideally updated daily by dispatch or by technicians clocking jobs.
- Dispatch system supplies average response time and SLA hit rate, refreshed daily since service performance shifts fast.
- CRM or sales pipeline tool supplies qualified backlog and weekly intake, refreshed weekly alongside the full report.
Project managers should update project cash position daily where possible, since a single missed change order can flip a job from green to red within a week. A simple report runner that pulls scheduled exports from each system on a set morning, with a manual fallback checklist for the weeks’ automation breaks, keeps the report reliable without adding headcount. Build in a validation check on DSO trend and reconcile unbilled revenue against the ledger monthly so the proxy numbers stay honest.
Pro Tip: Assign one person to own the Monday morning data pull, even if the long-term plan is full automation. A report that’s late because no one owns it defeats the purpose.
Building the one-page layout readers will actually use
The layout matters as much as the metrics. A flash report that takes more than sixty seconds to read gets skipped after week three.
Structure the page with a header carrying the date and the owner’s name, then three columns and a footer band:
- Left column: financial KPIs, cash on hand, working capital %, current ratio, DSO.
- Center column: open jobs, project cash position, budget variance, labor productivity.
- Right column: dispatch metrics, average response time, SLA hit rate, technician utilization.
- Bottom band: qualified backlog and the 4-week intake trend.
Each field needs four things: the current value, the change from last week, a small four-week trend line, and a red-amber-green light against target. Template providers like JobSite Viewer’s free KPI dashboard build reports around exactly this combination of sparklines, traffic lights, and week-over-week deltas, which makes short-term change easy to spot without reading a full statement.
A negative project cash position at 40% complete, well past the 25% target, should trigger same-week action: pull the billing schedule, issue the next progress invoice using contractor invoicing software, and flag the account to the collections owner.
Making the flash report part of the weekly routine
A flash report that sits in an inbox unread is worse than no report at all. The habit that makes it work is a five to ten minute Monday huddle: review only the red items, assign one owner per red item by name, and write down one action each will take before Friday. Green and amber items get a glance, not a discussion.
Escalation rules should be written down in advance: stop taking new work on a client with two invoices past 60 days, or assign the bird-dog collector once a receivable crosses a set threshold. Clients who have put structured KPI reporting and accountability systems in place have reported meaningful gains in operational clarity, including one maintenance agreement strategy that scaled toward a $21 million run rate. The report itself does nothing. The routine built around it does.
— Dan
How Rebuilding the Trades helps you build and run this system
Designing a flash report is the easy part. Getting a team to trust it, update it, and act on the red items every week is where most contractors stall.

Consultants work hands-on inside trade businesses to build KPI and reporting systems tailored to operations such as HVAC, plumbing, electrical, roofing, and remodeling, rather than using generic templates.
- KPI and report design tailored to job mix and crew structure.
- Management and leadership training to help supervisors interpret the report and take action.
- Accountability systems to support consistent review meetings.
Explore the full Rebuild program to see how a hands-on engagement gets a flash reporting system running and sustained past the third week.
Where to verify these benchmarks and grab a template
For readers who want to check the numbers or pull a working template:
- NFBA’s cash flow guidance for working capital and liquidity targets.
- CFMA’s monitoring best practices for the core KPI list.
- ELECTRI International’s benchmarking tool for labor and cash flow metrics specific to electrical contractors.
- JobSite Viewer’s free KPI dashboard template for a ready-made one-page layout.
Sources
- Managing the Lifeblood of Contracting – Cash Flow (NFBA)
- Best Practices for Monitoring Your Construction Business – CFMA
- ELECTRI International KPI benchmarking tool
- Free Construction KPI Dashboard Template | JSV — JobSite Viewer
FAQ
What is a flash report for a contractor?
A flash report is a one-page, weekly snapshot of the KPIs that matter most for fast decisions: cash on hand, project cash flow, technician productivity, dispatch performance, and backlog. It’s meant to be read in under a minute, unlike a full monthly financial statement.
How often should contractors update their flash report?
Weekly is the standard cadence for the full report, with cash and job-level data ideally refreshed daily since those numbers move fastest. CFMA’s guidance recommends keeping the list short enough that a weekly refresh is realistic for the team maintaining it.
What is a good current ratio for a contracting business?
A current ratio near 1.5 to 1 is a commonly recommended target for contractors, according to NFBA’s cash flow guidance. A ratio well below that signals the business may struggle to cover short-term obligations without a cash injection.
When should a project be cash positive?
A job still negative well past that point, such as 40% complete, is a red flag worth investigating that week rather than at month end, per NFBA’s recommendations.
Can Rebuilding the Trades help design a flash report for my business?
Yes, Rebuilding the Trades builds KPI and reporting systems as part of its hands-on operational consulting for HVAC, plumbing, electrical, roofing, and remodeling businesses. Details on the engagement are available on the Rebuild services page.
0 Comments