
Technician utilization is the share of a technician’s available hours that you bill to customers, and for most HVAC, plumbing and electrical shops the healthy range sits in the mid-60s to mid-70s percent. RollForge’s 2026 benchmarks put median utilization at 63% for HVAC, 61% for plumbing and 66% for electrical, with top-quartile shops at 72%, 70% and 74%. The number is only useful when you define it one way, track it by technician, and pair it with the things that keep techs on your payroll: predictable schedules, a path to advance, and leaders who communicate. Push utilization with no regard for those and you trade a better percentage for a higher turnover bill.
This guide is for owners who want a number they can trust and a plan to move it. It covers the formula, the traps in it, realistic targets by trade, the operational levers that work, and how utilization and retention feed each other.
TL;DR
- Utilization = billable hours ÷ available hours × 100. Choose one definition, write it down, and apply it to every technician.
- Published medians for 2026 run about 61% to 66% across HVAC, plumbing and electrical. Top-quartile shops reach 70% to 74%.
- Sustained utilization above roughly 80% usually means undercounted non-billable time or a crew with no buffer for overruns.
- The biggest drags are usually scheduling, dispatch, missing parts and drive time, not technician effort. Fix the system before you push the people.
- Retention and utilization are one problem: overbooked, underbooked and constantly rerouted techs are the ones who leave.
Table of Contents
- What technician utilization actually measures
- How to calculate it without fooling yourself
- What target should you aim for?
- Where utilization leaks, trade by trade
- Seven moves that raise utilization without breaking the crew
- Utilization and retention are the same conversation
- A 30-day plan to get your baseline
- Where we come in
- Our perspective
- FAQ
- Sources
What technician utilization actually measures
Utilization answers one question: of the hours you could have sold, how many did you sell? A tech scheduled for 40 hours who spends 26 of them on billable customer work is at 65%. The other 14 hours went to driving, shop time, callbacks, waiting and meetings, which is the example BRIX uses in its October 2026 guide.
It is a time-allocation metric, not a verdict on a technician. A tech at 55% may be stuck with a dispatcher who stacks jobs across town. A tech at 85% may be skipping the callback paperwork. Praxedo’s November 2026 guide makes the same point and notes that benchmarking guidance warns comparisons break down when organizations define productive and billable time differently.
Two related measures are worth knowing:
- Wrench time: the share of the workday spent doing hands-on work. It is stricter than utilization.
- Windshield time: time spent driving between jobs. Service Fusion’s October 2026 guide calls it the largest part of the gap between paid hours and wrench time for most mobile teams.
How to calculate it without fooling yourself
The most common formula is billable hours divided by available hours, times 100. Available hours are paid hours minus approved time off such as PTO and holidays. Simpro’s October 2026 guide treats that as the default method.
The choice of denominator matters more than most owners expect. In Simpro’s example, one plumber’s week of 22 billable hours out of 40 paid hours, with 4 holiday hours, comes out at 55%, 61% or 83% depending on whether you divide by all paid hours, by available hours, or add charged drive time. Same week, same tech, three very different numbers.
Decide what counts as billable
Write these rules down before you pull a single report:
- Billable: time on a job the customer pays for, whether time-and-materials or flat-rate.
- Drive time: it is paid time, and the U.S. Department of Labor treats travel between job sites during the workday as hours worked. For utilization, count it as billable only if you actually charge a trip fee. Be consistent either way.
- Non-billable: warranty work, uncharged callbacks, internal meetings, shop and stocking time.
- Mixed work: if you run both time-and-materials and fixed-price jobs, report them separately so a few big flat-rate installs do not hide a weak service week.
Avoid the averaging mistake
If you have full- and part-time techs, do not average their individual percentages. Simpro shows that doing so can give 62.5% when the true team figure, total billable hours over total available hours, is 67%. Add up the hours first, then divide.
Report by technician, trade and work type
A single company-wide number hides the problem. Split it by tech, by trade and by call type (maintenance, repair, install). For electrical work, Simpro’s electrical KPI article also recommends tracking by license class, so a master electrician is not sitting on journeyman-level service calls.
What target should you aim for?
There is no universal benchmark. Sources differ because they define hours differently and sample different shops. Use published numbers as a rough range and your own baseline as the real yardstick.
| Trade | Median | Top quartile |
|---|---|---|
| HVAC | 63% | 72% |
| Plumbing | 61% | 70% |
| Electrical | 66% | 74% |
Source: RollForge technician productivity benchmarks, 2026. The same report puts the ceiling for trade services at roughly 78% to 82%, above which the buffer for overruns erodes.
Other sources land in a similar neighborhood. Simpro’s March 2026 article says electrical utilization averages 66%, with top-quartile businesses at 82% or higher and a practical target of 75% for most operations. A WorkZen benchmark table from August 2026 notes that most healthy service businesses land between 60% and 75%, and that consistently going much higher signals undercounted non-billable time or burnout risk.
The practical read: if you are at 55%, there is room to grow without squeezing anyone. If you are at 70%, the next gains come from quality of work, callbacks and ticket size, not from more booked hours.
Why a higher number is not always better
A crew run at 85% or more has no slack. One long diagnostic, one missing part or one traffic jam pushes every later appointment. OnSiteQ describes 65% to 75% as a realistic, sustainable target for installation and maintenance businesses and warns that pushing consistently past 80% risks mistakes and burnout. Treat the mid-70s as a ceiling you approach on purpose, not a floor you punish people for missing.
Where utilization leaks, trade by trade
Most lost hours come from the same few places, and they differ by trade. BRIX’s trade-by-trade table is a useful map:
- HVAC: shoulder-season gaps between heating and cooling peaks, and long drives on emergency calls. Levers include spring and fall maintenance-agreement tune-ups and dispatching by location.
- Plumbing: mid-job supply-house runs and unbilled callbacks. Levers include standard truck stock and tracking first-time-fix rates.
- Electrical: waiting on inspections or permits and material pickups. Levers include grouping inspection days around other work and delivering materials to the job.
Notice what is missing from that list: nobody on it is lazy. The drags are structural. Technicians in ServiceTrade’s April 2026 survey of more than 800 service technicians named the same causes of slowdowns: office miscommunication (45%), poor scheduling or last-minute changes (44%), missing parts (40%), missing work order information (32%) and clunky mobile apps (32%). Every one of those is an office or management problem.
Seven moves that raise utilization without breaking the crew
- Fix dispatch before anything else. Route by location, keep emergency capacity deliberate, and stop the same-day reshuffles that techs rank among their top frustrations. Our work on first call completion covers the quick wins that cut return trips.
- Make the call-taker part of the system. A job booked with the wrong time slot, scope or address data is a lost hour before the truck leaves. See our HVAC CSR training plan for what 90 days of structured training looks like.
- Stock the truck and the job. Standard truck stock and pre-staged materials attack supply-house runs and missing-parts delays.
- Sell the slow season. Maintenance agreements fill the shoulder-season gaps. We wrote up a three-tier maintenance agreement strategy tied to a $21M run rate, and an eight-week shoulder-season plan for the weeks in between.
- Cross-train across divisions. Haller Enterprises’ president told HomePros News that about 20% of techs can move between residential, commercial and new-construction work, that one leader focuses solely on labor utilization, and that in January to April 2024 residential techs spent 20% of their hours on commercial work, avoiding hour cuts or layoffs.
- Track callbacks and first-time fix. Rework is the quiet killer: it eats billable capacity and customer trust at once.
- Put a named owner on it. Someone, whether a service manager or field supervisor, should own the utilization number weekly. Our pieces on service manager training and field supervisor training describe that role.
If you want a fuller list of numbers to review alongside utilization, our HVAC KPIs owners must track is the place to start.
Utilization and retention are the same conversation
Owners often treat utilization as a productivity project and retention as an HR project. Technicians experience them as one thing: their week.
The turnover numbers show the stakes. ServiceTitan’s analysis of technician records, covering the 12 months through January 2026, found turnover of 21% for electrical, 18% for plumbing and 16% for HVAC contractors, with average tenure between 3.2 and 3.96 years by trade. It also argues that when a tech leaves, a replacement takes six months to a year to reach baseline, so a departure costs you more than a vacancy.
Why HVAC techs leave
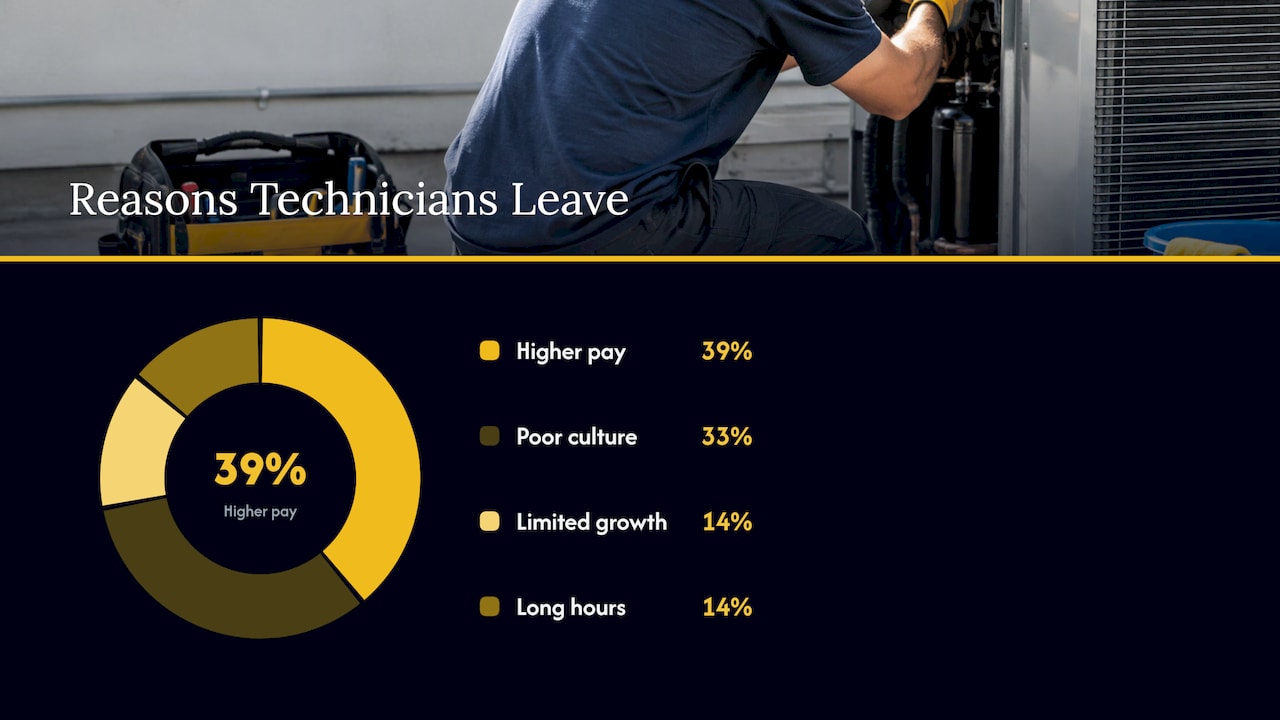
An October 2025 poll of 272 HVACR contractors reported in Contracting Business found 39% of techs leave for higher pay, 33% for poor culture or management, 14% for limited career growth or training, and 14% for long hours with no work-life balance. Pay is the biggest single reason, but culture, growth and hours together add up to more.
The scheduling link is direct. ServiceTitan’s 2022 analysis of data from thousands of contractors named five reasons employees look elsewhere: being overbooked, being underbooked, excessive driving, weekend work and a weak culture. The first four are utilization problems. A shop that runs one tech at 90% and another at 45% is creating two kinds of resignations.
When the ServiceTrade survey asked what would keep technicians long-term with pay held constant, they ranked better schedules and work-life balance first (44%), career advancement second (43%), recognition third (35%) and stronger leadership and communication fourth (27%).
What helps techs stay
- A visible ladder. Techs who can see the next role stay to earn it. Our HVAC career ladder maps the one-, five- and seven-year steps.
- Training that is structured. Our train-the-trainer plan lays out a 90-day approach aimed at lowering tech turnover.
- Predictable schedules. Fair on-call rotations and a stable daily plan do more for retention than most perks.
- Recognition and clear communication. A positive work environment helps companies in competitive industries attract and hold skilled people, and trades are no exception.
- Recruiting that matches your real operation. See our technician recruiting guide with KPIs.
The growth payoff
The top commercial contractors in BuildOps’ 2026 benchmark report, based on operational data from more than 1,500 North American contractors, generate 65% more revenue per technician than the average. The report credits tighter utilization, fewer callbacks and less admin and waiting time, and says those firms finish jobs in 11.2 days against 21.6 on average. Same crews, better system.
A 30-day plan to get your baseline
You do not need new software or a consultant to start counting. You need discipline.
- Week 1: Write your definition of billable, available and non-billable hours. Put it on one page.
- Week 2: Pull four weeks of timesheets and job records. Compute utilization by technician, then by trade and call type.
- Week 3: Rank the gaps by hours lost: drive time, callbacks, waiting, shop time, unassigned time. The top two are your project.
- Week 4: Pick one fix per gap, give each an owner, and set a weekly review. Aim for a few points of improvement per quarter, not a leap.
If the numbers cannot be pulled cleanly, that is itself the finding. Financial and operational visibility come first, and our guide to contractor financial reporting shows what to track. Labor cost is the other half: see labor burden for contractors to put a real cost on each hour you fail to bill.
Where we come in
Rebuilding the Trades works only with trade businesses: HVAC, plumbing, electrical, roofing, remodeling and siding. Our work is hands-on and in the field, and it covers the pieces that decide utilization: Call Management & Dispatch Training, Management & Leadership Training, Financial Operations and Compliance Assistance, and onsite audits, KPI and reporting systems, and accountability systems.
If you want a second set of experienced eyes on your dispatch, your numbers and the leaders who own them, see how the Rebuild program works.

You can also read how owners have applied this in our Elmers case study.
Our perspective
Most owners come to us thinking their techs need to work harder. After walking a shop, we almost always see something else: a dispatch board nobody owns, a call-taker booking without the full picture, a service manager with no numbers, and techs who have learned that the plan changes by noon.
Utilization is a symptom. When we build it up, we start with the leaders. A service manager who reviews billable hours, callbacks and drive time every week and coaches from the data does more than any tool or pep talk. That is why our work combines onsite audits, leadership training and accountability systems built for the trades.
The same changes tend to help retention, because techs stay where the day makes sense and where somebody notices good work. Chasing a percentage alone is a mistake. Build a shop where the schedule is stable, the trucks are stocked and the path forward is visible, and the number follows.
Dan
FAQ
What is a good technician utilization rate for an HVAC company?
Published 2026 data puts the HVAC median at 63% and the top quartile at 72% (RollForge). Because shops define hours differently, set your own baseline first and improve from there. A few points per quarter is a realistic pace.
Should drive time count as billable?
Only if you charge a trip fee for it. Drive time between jobs during the workday is paid time under U.S. Department of Labor guidance, but paid does not mean billable. Whatever you choose, apply it to every technician so the numbers compare.
Can utilization be too high?
Yes. Above roughly 80% on a sustained basis, techs rush between jobs with no buffer, which raises the risk of mistakes, callbacks and burnout. A consistently very high figure also often means non-billable time is going unrecorded.
How does technician utilization affect retention?
Both overbooking and underbooking appear among the reasons techs seek other work, along with long drives and weekend shifts. Technicians surveyed also ranked schedules and work-life balance as the top thing that would keep them. Steady, predictable days support both a healthier utilization rate and longer tenure.
Sources
- Technician Utilization Rate: Formula and Fixes, BRIX
- Technician Utilization Rate: Formula and Benchmarks, Simpro
- Electrical KPIs: The Metrics That Protect Margin in 2026, Simpro
- Technician Utilization Rate: How to Calculate It, Praxedo
- Reduce Idle Time for Field Technicians, Service Fusion
- Technician Productivity Benchmarks for HVAC, Plumbing & Electrical, RollForge
- Improve Technician Utilization, WorkZen
- How to Measure and Improve Technician Utilization, OnSiteQ
- U.S. Department of Labor, Fact Sheet 22: Hours Worked under the FLSA
- Haller Enterprises president on shifting technicians across divisions, HomePros News
- Mechanical Contractor Technician Retention survey, ServiceTrade
- Technician turnover and tenure by trade, ServiceTitan
- To prevent technician churn, ServiceTitan
- Stop the Revolving Door: Smart Retention Tactics for HVACR Contractors, Contracting Business
- 2026 Commercial Contractor Benchmark Report, BuildOps
- Fostering a Positive Work Environment to Attract and Retain Top Talent
0 Comments